Money Moves Markets
Questioning US economic “strength”
December 6, 2023 by Simon Ward
The 5.2% annualised increase in the headline expenditure-based measure of US GDP in Q3 partly represents payback for earlier weakness. GDP has risen at a modest 1.7% annualised pace since end-2021, well below average expansion of 2.5% in the five years preceding the pandemic (i.e. to end-2019).
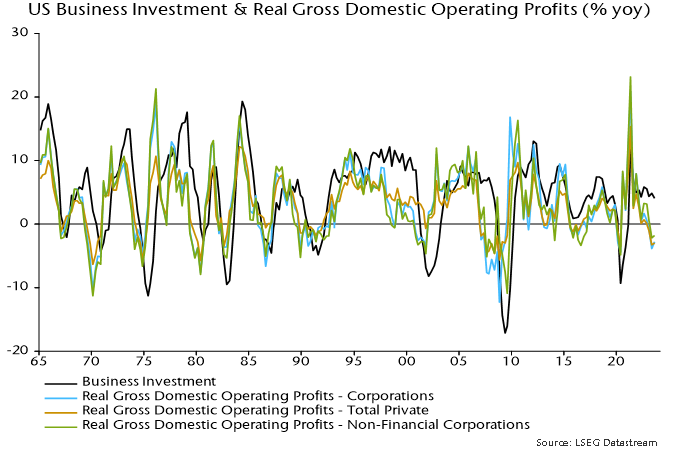
The alternative income-based measure of GDP – gross domestic income – paints a much more miserable picture. GDI grew by 1.7% annualised in Q3 alone and by only 0.4% in the seven quarters since end-2021 – see chart 1.
Chart 1
It has been suggested that the GDP / GDI divergence is capturing an increased reliance on borrowing and / or savings depletion to finance spending. This is incorrect: GDP and GDI measure the same concept and the divergence reflects a rising statistical discrepancy, with GDP 2.6% higher than GDI in Q3.
The higher level of GDP does not imply that the GDI measure is less inclusive or accurate. Research by Jeremy Nalewaik, then a Fed economist, found that early GDI estimates were a better gauge of cyclical fluctuations and predicted the direction of future revisions to GDP.
If the national accounts evidence suggests lacklustre performance at best, what explains the consensus perception of US economic “strength”?
The answer seems to be unusually rapid growth of payroll employment. Payrolls rose at a 2.8% annualised rate between Q4 2021 and Q3, significantly outpacing GDP expansion of 1.7%.
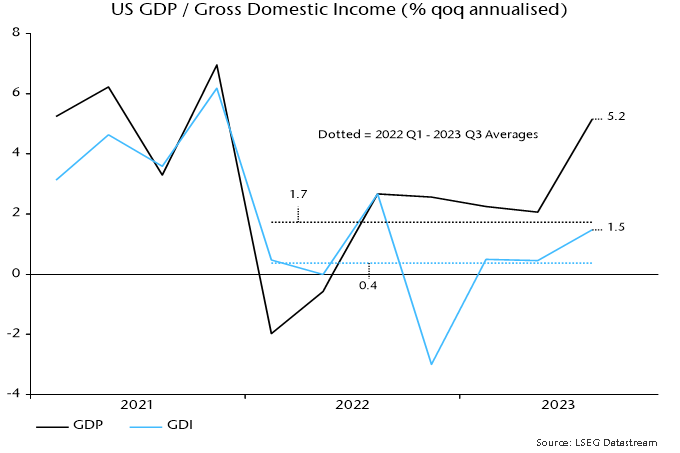
Payrolls strength is judged here to reflect a normalisation of the relationship with the level of GDP, following an undershoot of trend during the pandemic – chart 2. This adjustment appears complete, implying that payrolls will lag GDP going forward (the slope of the trend line implies an annualised growth shortfall of 1.0%).
Chart 2
The GDP / GDI contrast is particularly stark over the latest four quarters, during which GDP grew by 3.0% but GDI contracted by 0.2%.
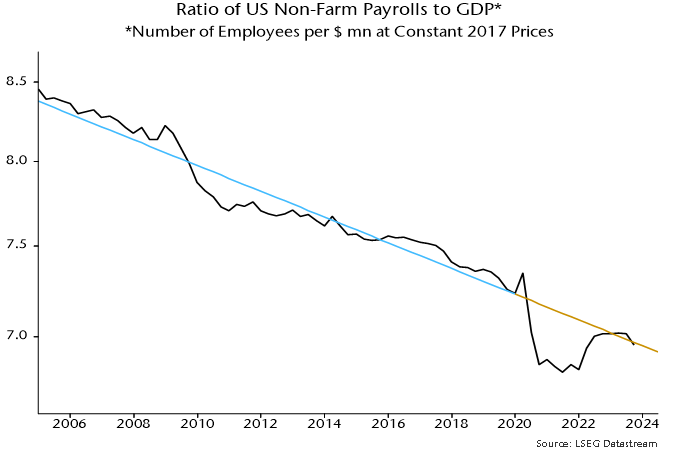
The table below shows the contributions of GDI components to its change over the past year. With real wage income growing solidly, GDI contraction was attributable to falls in real operating profits of corporations and other private enterprises.
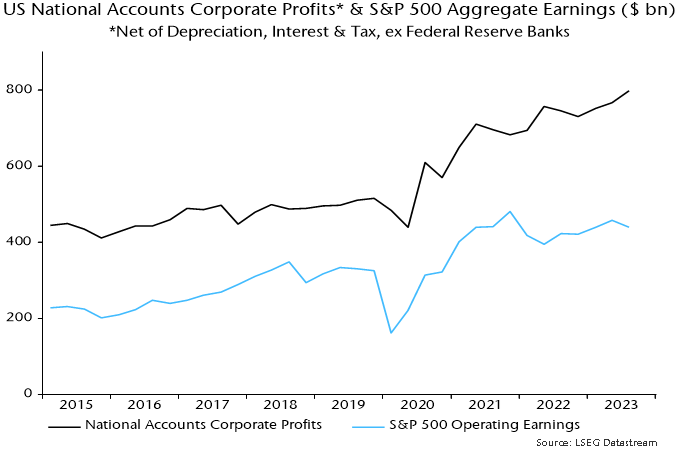
Is national accounts profits weakness consistent with company earnings data? GDI operating profits are gross of depreciation, interest and taxes and exclude foreign earnings, so adjustments are necessary to align with S&P 500 earnings. Chart 3 compares nominal data for S&P 500 aggregate operating earnings and an equivalent national accounts-based measure for corporations excluding the Fed. S&P earnings grew more slowly in the year to Q3, so there is no suggestion of a negative discrepancy in the national accounts numbers.
Chart 3
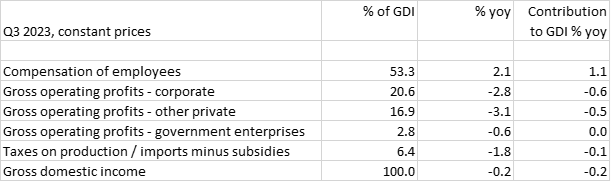
Real operating profits are a leading indicator of business investment so the contraction in recent quarters suggests a capex downturn ahead – chart 4.
Chart 4