Quarterly Liquidity Insights
Quarterly Liquidity Insight
March 31, 2026
Cycle analysis indicates that the global economy is in a time window for weakness, suggesting a significant risk that the Gulf War III shock triggers a recession. Real money trends will be key for assessing whether a negative scenario is playing out.
The housing, business investment and stockbuilding cycles average 18, 9 and 3.5 years respectively. The most recent lows are judged to have occurred in 2009, 2020 and 2023, suggesting that the next bottoms will be reached around 2027, 2029 and 2027. All three cycles, therefore, are expected to be in downswings over the next 1-3 years.
Cycle history suggests two possibilities. If the three downswings coincide, a major recession is likely. Historical precedents include the severe global downturns of 1974-75 and 2008-09.
If the cycle lows are spaced out over several years, the template would be the early 1990s – a longer period of rolling economic weakness involving a less damaging recession.
An earlier episode of triple cycle weakness in the late 1950s was also associated with a less pronounced recession but the fall in output on that occasion was limited by strong trend economic growth, reflecting post-war reconstruction.
The impact of shocks on the global economy depends on the cyclical backdrop. Activity bounced back strongly after the 2020 covid shock partly because the stockbuilding and business investment cycles were in time windows to enter recovery phases, while the housing cycle remained in an upswing.
Similarly, economic damage from the 2022 energy shock due to Russia’s invasion of Ukraine was limited by support from the business investment and housing cycles, with only the stockbuilding cycle then in a weak phase.
The timing of the Gulf War III shock echoes the 1973 Arab oil embargo, which hit as the three cycles were peaking and resulted in synchronised and self-reinforcing downswings into 1975 lows.
There are important mitigating differences from the 1973 shock. The oil price rise has been much smaller, while the oil intensity of GDP has fallen significantly. The 1973 shock occurred against a backdrop of double-digit G7 money growth, ensuring an inflationary outcome – current expansion is still low. Surging inflation forced major monetary policy tightening, the combined result being a severe real money squeeze – see chart 1.
Chart 1
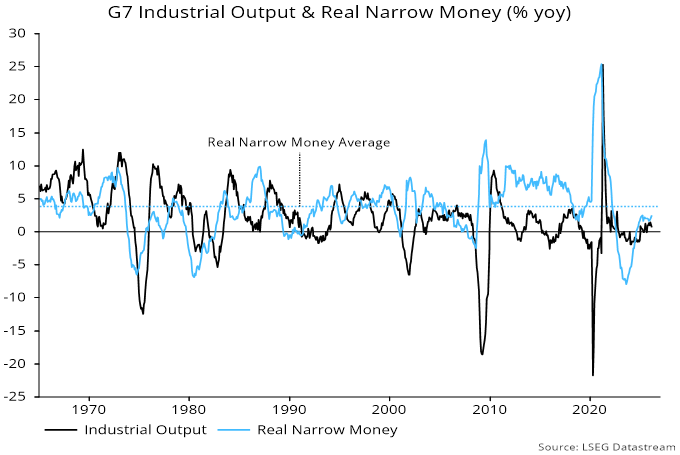
Real money trends appeared modestly supportive before the current shock: global / G7 growth had firmed into early 2026, suggesting that economic expansion was on course to hold up through Q3.
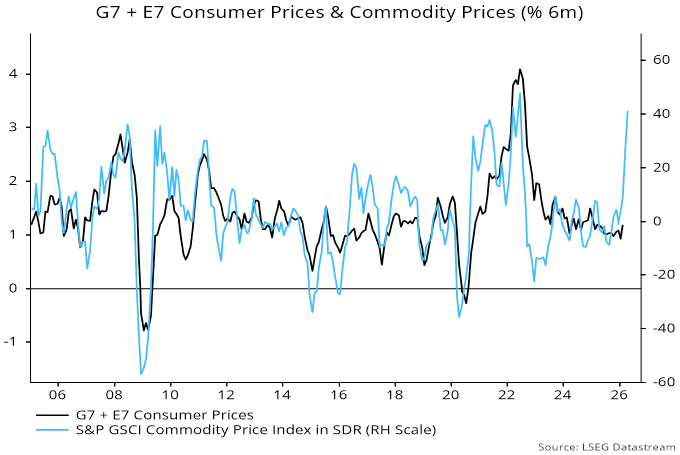
The mechanical impact of higher energy and other costs on consumer price inflation will ensure a sharp slowdown in real money momentum into mid-year – chart 2. The extent of the decline will be key for assessing the likely degree of economic weakness. As noted, modest money growth argues against significant “second-round” inflation effects but central banks are hinting at precautionary tightening, which would magnify monetary weakness.
Chart 2
A further risk is of “endogenous” monetary tightening if the Gulf War III shock interacts with recent problems in private lending, leading to a generalised reduction in credit availability. Such a shift could be signalled in ECB and Fed loan officer surveys due in late April and early May respectively.
Country real money numbers through February suggest that US economic prospects were improving absolutely and relative to other majors before the shock – chart 3.
Chart 3
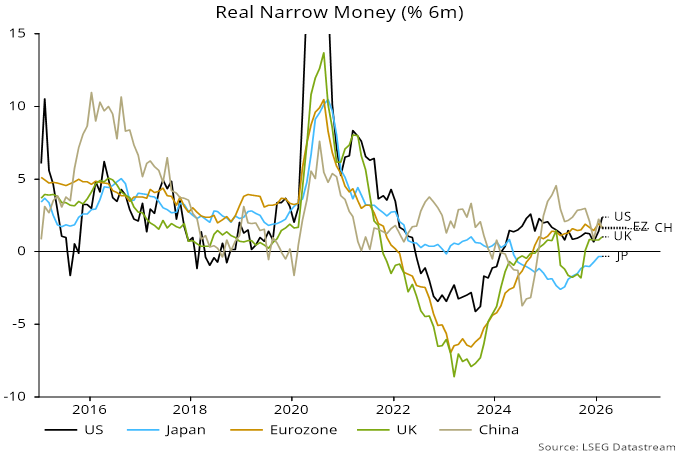
Japanese monetary weakness continues to argue that BoJ policy tightening – via large-scale QT as well as rate hikes – has been misguided. As expected, core CPI inflation – ex. food and energy – has fallen and is below 2% even stripping out the impact of government subsidies.
Recoveries in Eurozone and UK real money momentum have stalled at unimpressive levels, suggesting dull economic prospects before the shock. Within the Eurozone, readings are similar across the large economies, with France no longer a negative outlier.
Chinese real money momentum has slowed but may hold up better than elsewhere going forward, reflecting stable interest rates and government intervention to limit price rises. A strong balance of payments position, partly stemming from a still significantly undervalued currency, is generating monetary inflows.
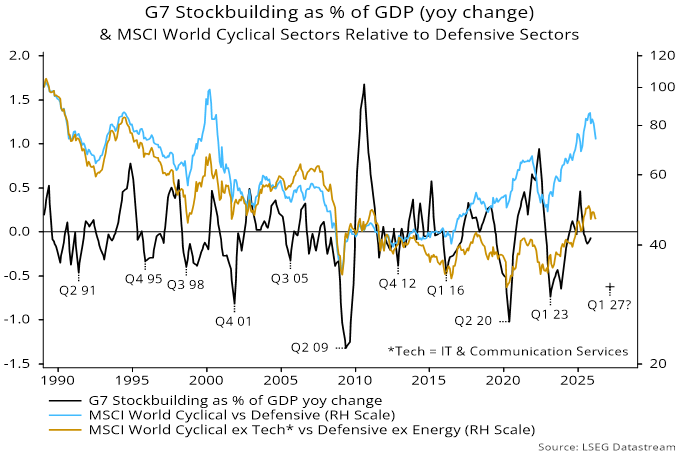
Cyclical equity market sectors had started to underperform before the shock. The cyclical / defensive relative is correlated with the stockbuilding cycle, which is not expected to bottom before late 2026 at the earliest – chart 4.
Chart 4


![Jean-Philippe-Lemay, CC&L FG [504x504_03]](https://ns-partners.cclgroup.com/wp-content/uploads/sites/3/2025/06/FG_-Jean-Philippe-Lemay_504x504_03.jpg)