Commentary
Taking stock of EM performance
July 31, 2026

As you can see in the performance chart below, the AI capex boom has been by far the dominant driver of returns this year.
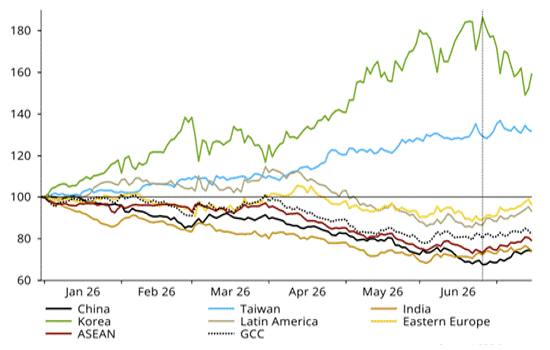
Source: NS Partners and LSEG Datastream.
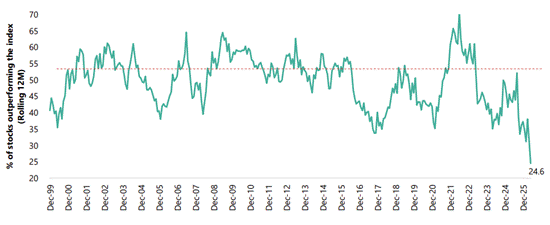
The rally in emerging markets this year has been so narrow that less than 25% of stocks have outperformed the benchmark.
MSCI EM – Percentage of stocks outperforming the index (rolling 12-month)
Source: Jefferies Equity Research, June 2026.
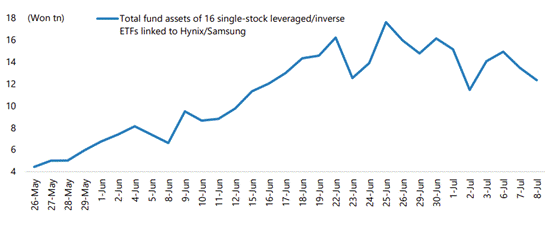
South Korea’s outperformance has been driven to an extreme by local retail participation in leveraged/unleveraged single-stock ETFs.
Fund assets of 16 single-stock leveraged/inverse ETFs linked to Hynix and Samsung Electronics
Source: Jefferies Equity Research, July 2026.
We are now seeing some profit taking and de-leveraging in overcrowded areas, and the correction from the highs among semiconductor stocks has been sharp, with the KOSPI correcting over -30% from its June peak.
Despite hitting oversold levels, our inclination is not to catch the falling knife and double down, but rather wait for signs of consolidation in tech while looking for opportunities in EM laggards outside North Asia.
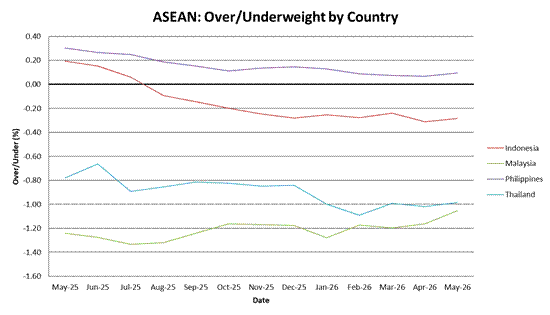
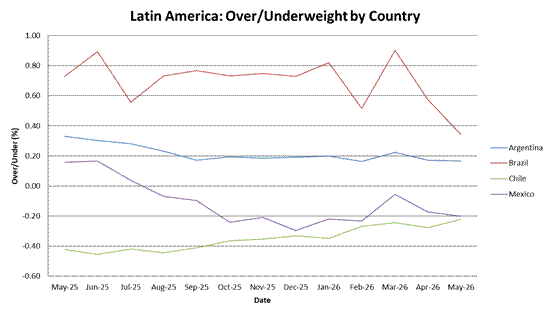
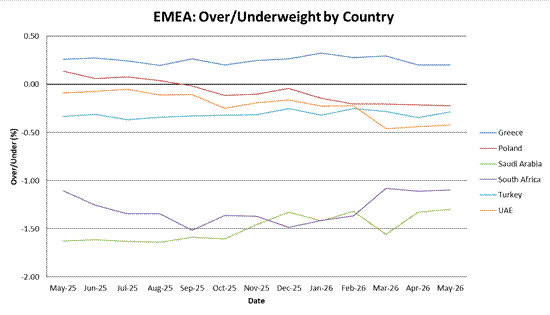
The positioning data below from EPFR illustrates how many markets outside of Taiwan and South Korea have been abandoned by investors and may offer up some attractive opportunities.
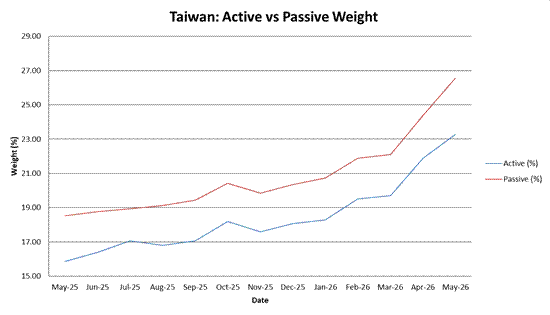
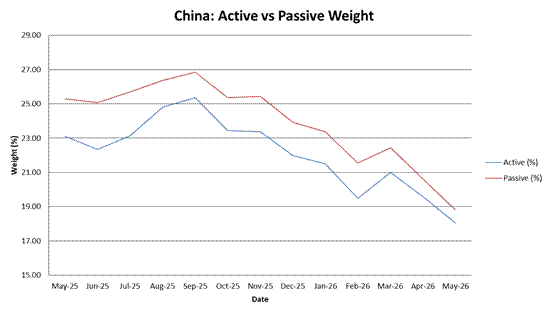
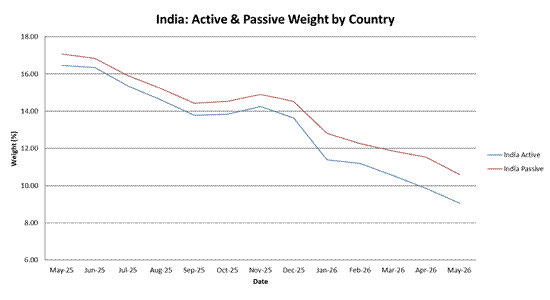
The dominance of South Korea and Taiwan market performance over the last 12 months is reflected in significantly lighter positioning elsewhere
South Korea: 9.2% → 21.7%, OW vs benchmark went from +1.6pp to +5.3pp
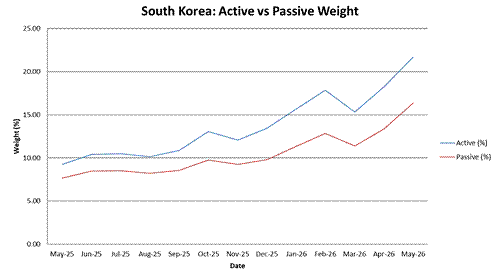
Taiwan: 15.9% → 23.3%, active weight rose sharply, yet Taiwan active remains underweight vs benchmark. UW widened to −3.3pp from −2.6pp
China: 23.1% → 18.0%, cut heavily and UW vs benchmark narrowed from −2.2pp to −0.8pp
India weighting has nearly halved from the peak
India the “AI loser”
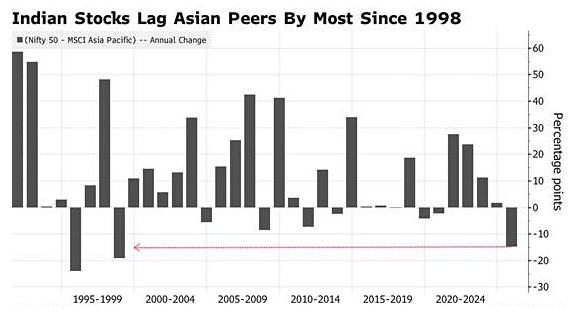
From the charts above, India stands out as the biggest victim of the enthusiasm for North Asian tech stocks. Just a couple of years ago India was one of the standout equity markets over a period of decades. Now Indian stocks cannot seem to catch a break.
Since the end of 2024, India’s weighting in the MSCI EM benchmark has fallen from nearly 20% to 9% today, as Taiwan and South Korea have surged from a quarter to almost half the benchmark. Last year, Indian equities posted their worst year relative to Asian equities since the 1990s.
Source: Bloomberg
Broken story?
In the lead up to the market peak in 2024, India’s investment narrative was the ideal EM structural growth story:
- Continental-sized economy enjoying healthy growth.
- Favourable demographics, the largest working age population accounting for around 69% of the population (United Nations Population Prospects 2025).
- High levels of education, producing over 2.5 million STEM graduates annually.
- Over a decade of stable politics under Prime Minister Modi.
Indeed, it was this final point that we were most excited about, as a decade or more of stable politics and positive incremental reforms were beginning to bear fruit. Our conviction for India’s bright prospects rest on an understanding that institutional quality is a crucial factor for unlocking sustained economic growth and moving up the development ladder.
Institutional quality can be the difference between a country like Argentina – which, at the beginning of the 20th century was one of the richest countries on the planet, to where it is today with high inflation and political dysfunction (although, under President Milei, Argentina is taking its first steps to resolve this) – and Singapore, one of the poorest countries on earth 50 years ago, before taking off in an era of rapid development to be one of the richest countries in the world today.
Is the market signalling that something is broken in India?
Incremental reform
Modi’s tenure has brought with it initiatives including bankruptcy law reform, sanitation universalisation, electrification of rural India, a national goods and services tax, demonetisation and digital payments infrastructure. Any one of these initiatives may seem relatively trivial in isolation. However, it is the compounding effect of these incremental steps that can create a virtuous circle that unlocks the next upward shift in wealth.
For a country the size of India, that progress will see several hundred million Indians join the formal economy and accumulate wealth, which can in turn present a host of opportunities for investors with the framework to harness these structural tailwinds.
We think this story remains intact.
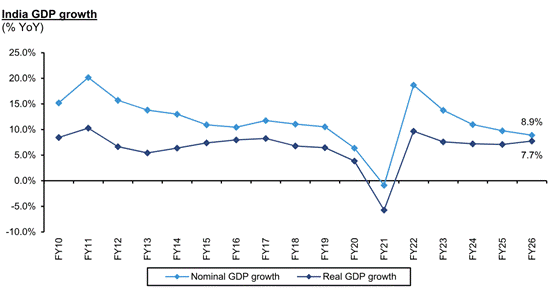
GDP growth among the best in EM
Source: Berstein, June 2026
Multiple headwinds
Foreign investors have abandoned Indian equities, having designated the market an “AI loser” due the disruption of its five-million-strong IT services sector. Higher energy prices on the back of the US-Iran conflict have been an added headwind.
Annual foreign net buying of Indian equities
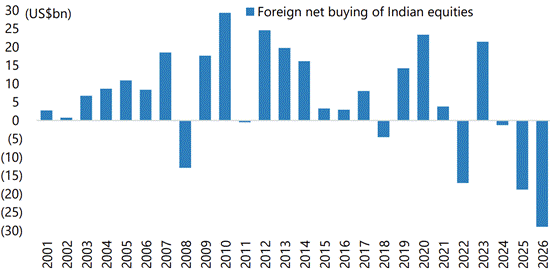
Source: Jefferies Equity Research, June 2026
After a decade of strong performance, India was an obvious source of funds to add to South Korea and Taiwan as the boom in hyperscaler capex saw the earnings of tech hardware companies in those countries skyrocket.
The foreign exodus has come as earnings growth for the market has fallen below the highs of 2022–2024 (over 30%). It appears to have troughed at 5.8% in 2025 and is forecast to accelerate into the mid-teens by 2027.
Lots of paper coming out
A stream of IPOs coming to market soaking up liquidity has been an added drag. In the financial year ending March 2026, an all-time high of 266 IPOs were filed with SEBI, and since March we have seen another 39 filings in three months suggesting these headwinds will persist.
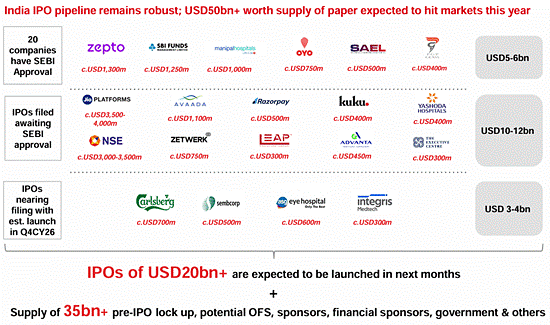
Source: HSBC India Equities, July 2026.
While this is a short-term headwind, these listing are the makings of a far deeper and more diverse opportunity set for investors in India.
Still not cheap
On a price-to-earnings basis MSCI India trades one standard deviation above its 20-year average premium to MSCI EM of 1.5x, although on a price to book basis it looks reasonable.
MSCI India Trailing Price to Book
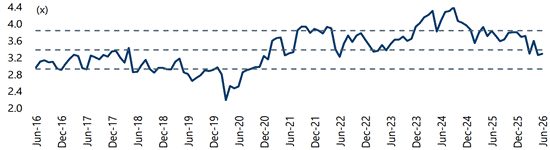
Source: Bloomberg.
There are pockets of value and positive earnings revisions across financial services, banks, real estate, software, healthcare and retail staples, but this is beside the bigger structural point. In India we have the institutional reform story fuelling sustained economic and corporate earnings growth, and a deep opportunity set of companies with high-quality management teams.
Key mantra: be careful relying on mean reversion tables when there is positive structural change taking place
Alongside the reforms mentioned above, the development of India’s domestic pension and mutual fund industry is a powerful force which can drive stock market re-rating. Just as we saw in places like Australia and Chile, the creation of a structural, non-cyclical source of demand for financial assets can create powerful feedback loops. Below is a rough schematic:
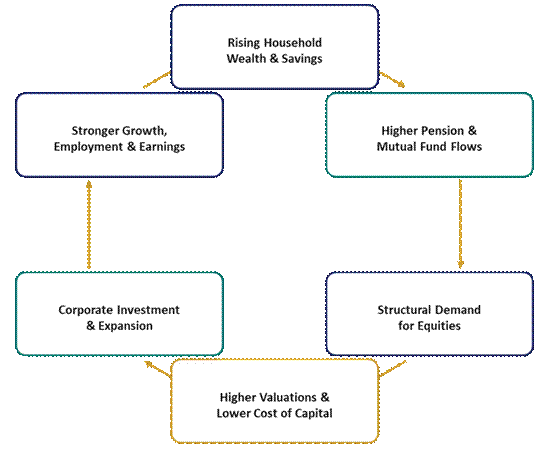
Jefferies Head of Global Equity Strategy Chris Wood has been one of the leading strategists emphasising the importance of these pension and mutual fund flows. His charts below illustrate that while foreigners have run for the exits, domestic demand for Indian equities remains robust.
Monthly net inflows into domestic equity mutual funds
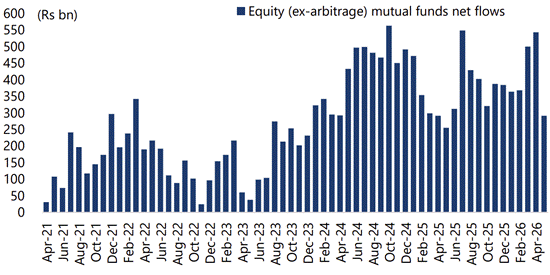
Note: Exclude arbitrage funds. Data up to May 2026.
Source: AMFI, Jefferies
Estimated National Pension System (NPS) flows into equities
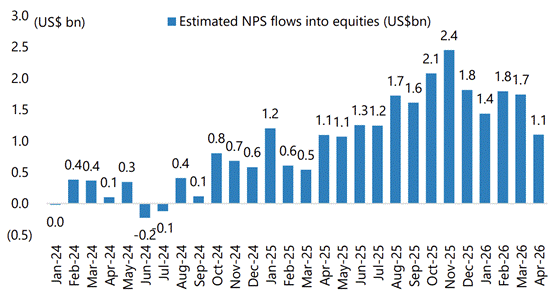
Source: Jefferies Equity Research, June 2026.
The AI earnings boom in Korea and Taiwan has captivated investors over the past 12 months. While we have held a healthy overweight to the theme for several years, we maintain a wide aperture in our search for positive structural stories across a diverse opportunity set in emerging markets. Despite being distinctly out of favour, India’s rise up the development ladder remains one of the most exciting opportunities in the asset class.
Next month we will publish a few examples of some brilliant companies in India capitalising on these structural trends, and where stock market malaise has presented us with some attractive entry points.



![Jean-Philippe-Lemay, CC&L FG [504x504_03]](https://ns-partners.cclgroup.com/wp-content/uploads/sites/3/2025/06/FG_-Jean-Philippe-Lemay_504x504_03.jpg)