Commentary
Rallying EM equities reflect an AI-powered earnings surge
May 20, 2026

Emerging market equities have outperformed the rest of the world year to date.
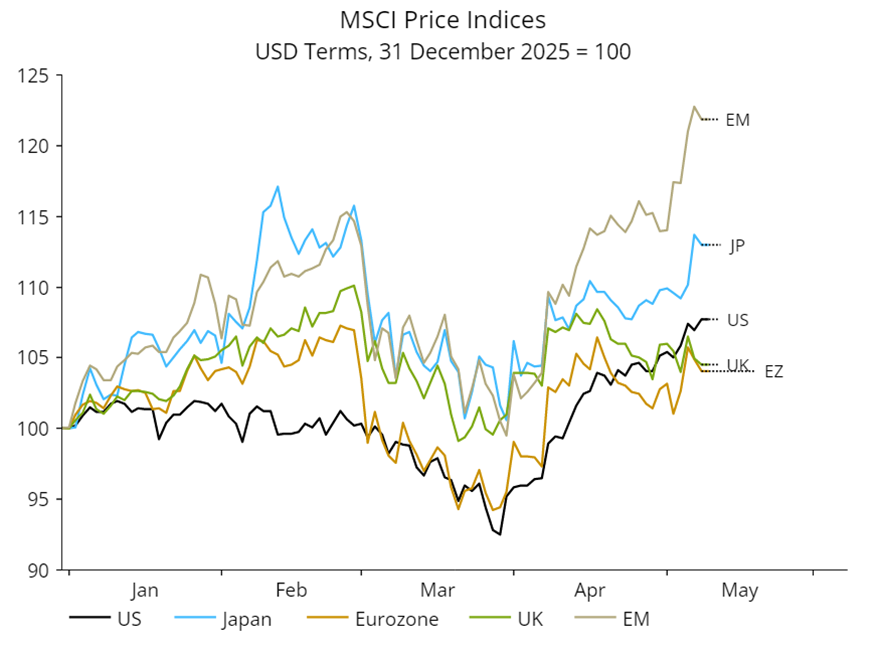
Source: NS Partners and LSEG Datastream
The asset class is decisively breaking out of a long-run trend of underperforming developed markets.
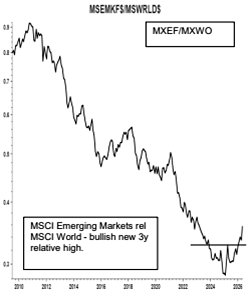
Source: Bank of America, May 2026.
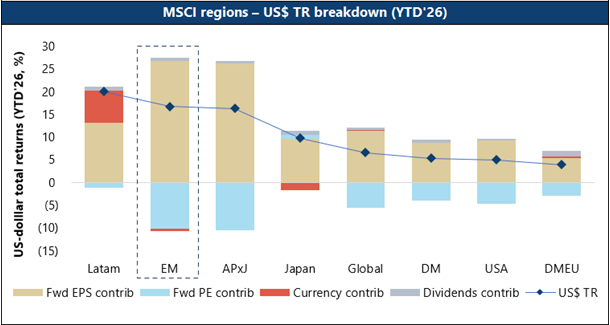
What is driving the turnaround? Looking at contributions to returns since 2023, earnings have been the clear driver for emerging market equities, with multiple expansion only a minor contributor.
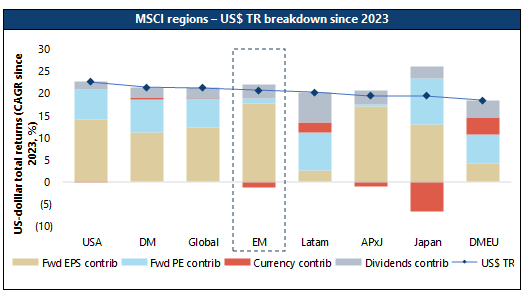
Source: Jefferies quant research, April 2026.
Earnings growth has been the key driver
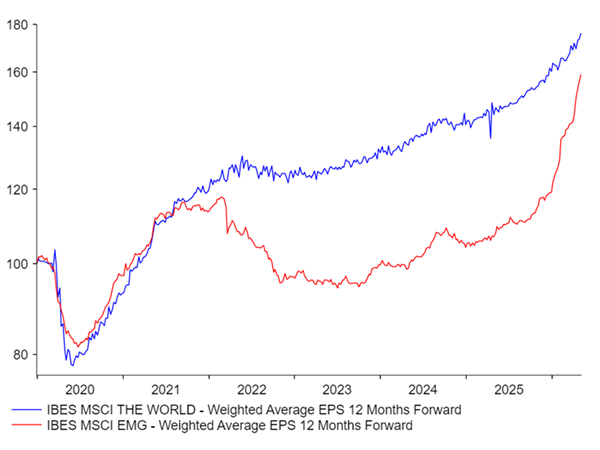
Source: NS Partners and LSEG Datastream.
In fact, for the year to date as at the end of April, valuation compression has been a headwind for the asset class.
Source: Jefferies quant research, April 2026.
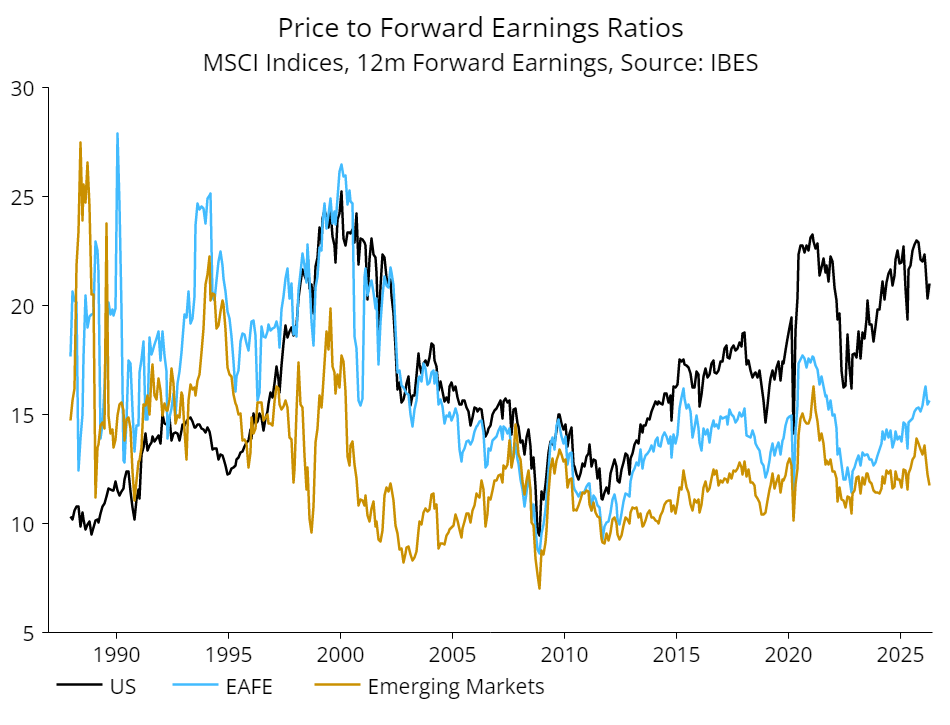
EM equities are now cheaper than they were in beginning of 2025 despite strong returns.
Source: NS Partners and LSEG Datastream.
We flagged in previous pieces that the signals we track suggested emerging market equities were positioned to outperform their developed market counterparts. Based on the headline numbers it appears this call has been vindicated (albeit over a short period) with the welcome combination of cheaper valuations and a strengthening earnings outlook.
What got us particularly excited was the potential for a US dollar bear market driving a new virtuous circle, as illustrated below.
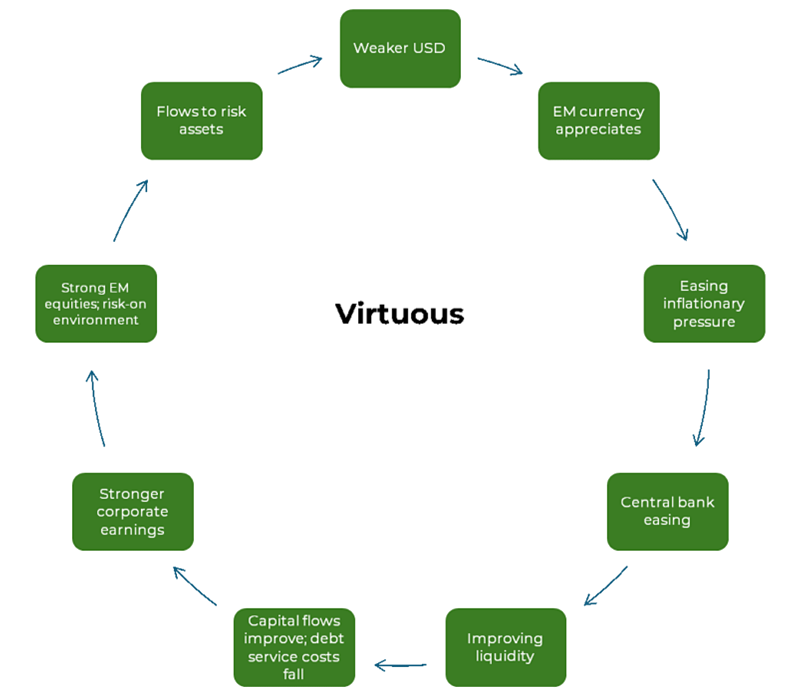
We have had positive spurts in a number of markets which enjoyed easing currency pressure courtesy of a falling dollar and better liquidity. However, this has been overwhelmed by the US AI boom which is bleeding out into emerging markets with North Asia the clear winner.
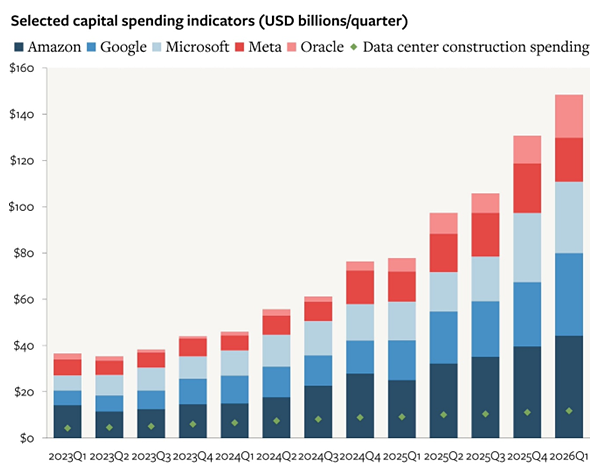
It has been a narrow rally driven by US capex and the AI supply chain
This dramatic improvement in earnings and performance largely reflects a boom in South Korean and Taiwan tech companies. If you strip these markets out of EM, the return picture for the wider asset class is subdued.
YTD outperformance of EM equities has been entirely due to Korea/Taiwan, with the rest of the asset class lagging DM

Source: NS Partners and LSEG Datastream
The demand boom for key technologies that underpin the infrastructure needed to meet a massive build out of AI technologies and the flow through to earnings growth is swamping interest in other positive stories across the asset class.
We are modestly overweight AI supply chain leaders in South Korea and Taiwan, who control key supply bottlenecks across memory and logic chips, thermal cooling, signals and switching, electrification and data centre assembly. Earnings growth and margins for these companies are downstream of rising investment from US hyperscalers seeking vast amounts of compute power to develop cutting-edge large language models.
Source: Koyfin, April 2026.
Portfolio names in these areas have posted outstanding gains over the last 12 months. While we have been quick to trim positions when stock valuations exceed what we think is reasonable, we have not run away from the rally and have maintained the overweight as we can see the fundamentals accelerating. For example, the supply-demand mismatch for high bandwidth memory is so great that memory giants SK Hynix and Samsung Electronics are now among the most profitable companies in the world.
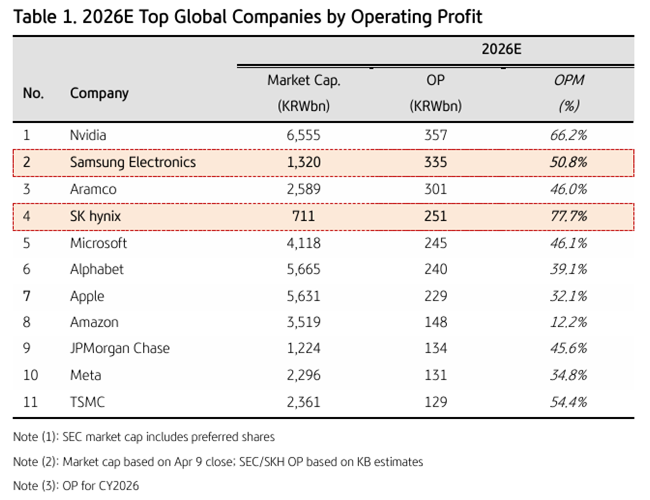
Source: Jefferies March 2026.
Earnings growth in South Korea has been so strong that valuations still look modest despite the market doubling
Samsung Electronics, Hynix and Micron are the only three companies in the world capable of producing HBM chips that are crucial components in Nvidia GPU clusters. And yet, Samsung and Hynix trade at a price to earnings multiples of less than 5x.

Source: Deutsche Bank 2026.
Optically, cheap valuations reflect a market view that these remain deeply cyclical businesses in an industry with a history of violent booms and busts and thus lack the durability in the earnings growth to award a higher multiple.
Looking at the table above, there may be a good argument that the DRAM giants are over-earning and will attract competitors. On the other hand, we are mindful that AI innovation represents a major technological shift and the possibility that this could structurally alter demand dynamics in an oligopolistic industry controlling essential and hard to replicate technologies.
Maintaining conviction with tight risk management
While the pace of capex spending by the US hyperscalers and the cash flows going to hardware suppliers is extraordinary, the parabolic stock moves in a number of the names that we hold naturally make us twitchy. Major uncertainty remains over how LLM technologies will evolve and be monetised, whether competitor frameworks will gain dominance, and if real-world bottlenecks in memory and energy may ultimately slow the pace of development.
We have been careful to trim winners and recycle profits elsewhere in emerging markets where we are seeing other opportunities that excite us. Equally, relatively modest valuations and earnings visibility on our time horizon represent a significant upside risk which leaves us happy to maintain our overweight to the AI supply chain.



![Jean-Philippe-Lemay, CC&L FG [504x504_03]](https://ns-partners.cclgroup.com/wp-content/uploads/sites/3/2025/06/FG_-Jean-Philippe-Lemay_504x504_03.jpg)