Money Moves Markets
Have Far East central banks called a US dollar top?
May 23, 2024 by Simon Ward
USD sales by monetary authorities in Japan, China and other Far East economies have probably topped $100 billion since April, exceeding intervention around the October 2022 dollar peak.
Market estimates are that JPY purchases / USD sales by the Bank of Japan on behalf of the Ministry of Finance on 29 April and 1 May totalled about ¥9 trillion / $ 57 billion. Official numbers covering the period from 26 April will be released next week.
Previous record monthly JPY purchases of ¥6.35 trn in October 2022 were associated with a USDJPY decline of 11.5% from October through January 2023 (month average data) – see chart 1.
Chart 1

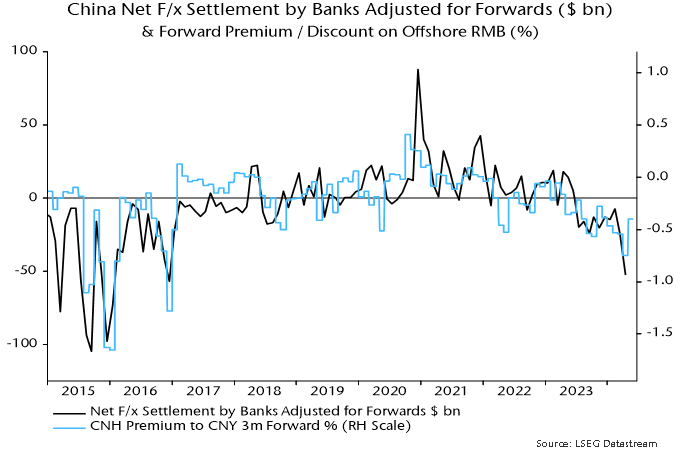
Chinese intervention is best measured by the sum of net foreign exchange settlement by banks and the change in their net forward position, since currency support operations are often conducted via state-owned financial institutions rather than by the PBoC using official reserves (h/t Brad Setser).
This series suggests USD sales of $53 billion in April, the largest since December 2016. Increased pressure for currency support had been signalled by a blow-out in the forward discount on the offshore RMB – chart 2.
Chart 2
The Bank of Korea may have sold about $5 billion in April, judging from the change in value of reserves. With other Far East authorities also intervening, total USD sales may have exceeded $115 billion.
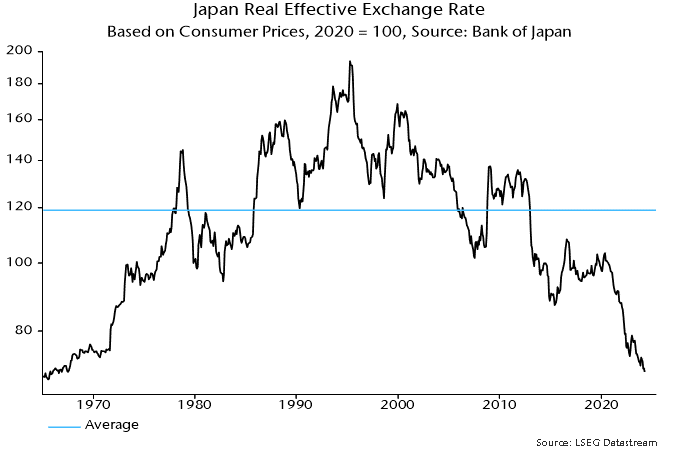
Intervention is more likely to be effective when supported by shifts in “fundamentals”.
The Bank of Japan’s real effective rate index, based on consumer prices, is at its lowest level since the late 1960s – chart 3*.
Chart 3
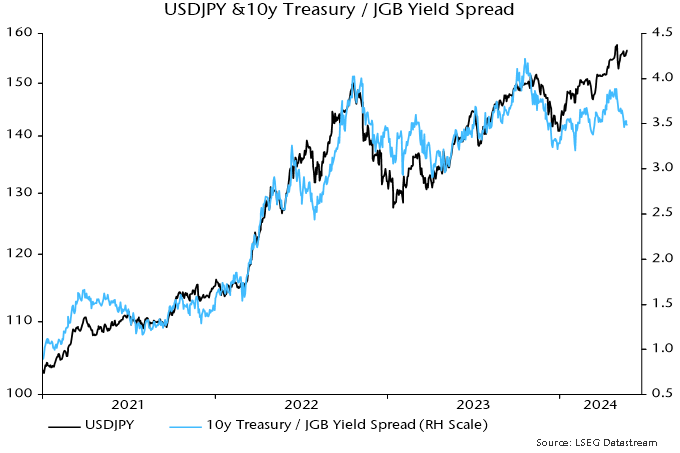
The USDJPY exchange rate has been tracking the 10-year US / Japan government yield spread but there was a negative divergence at the most recent dollar high – chart 4.
Chart 4
Major USDJPY turning points historically were usually preceded by a reversal in the US / Japan relative trade position, which peaked around a year ago – chart 5.
Chart 5
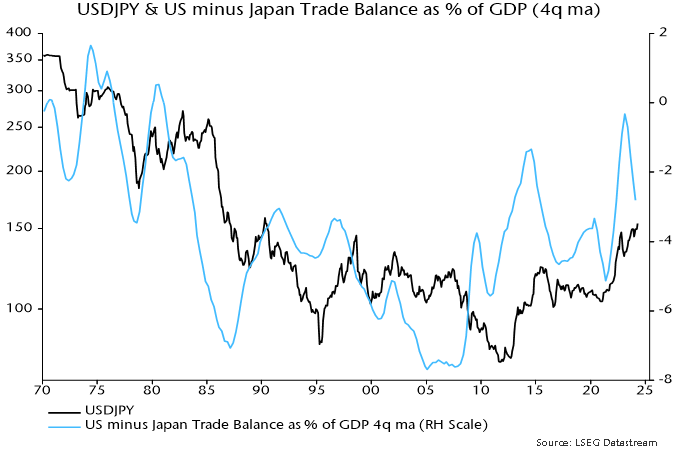
Trade deficits have narrowed in both countries but Japan’s improvement has been sharper, reflecting greater sensitivity to lower energy costs.
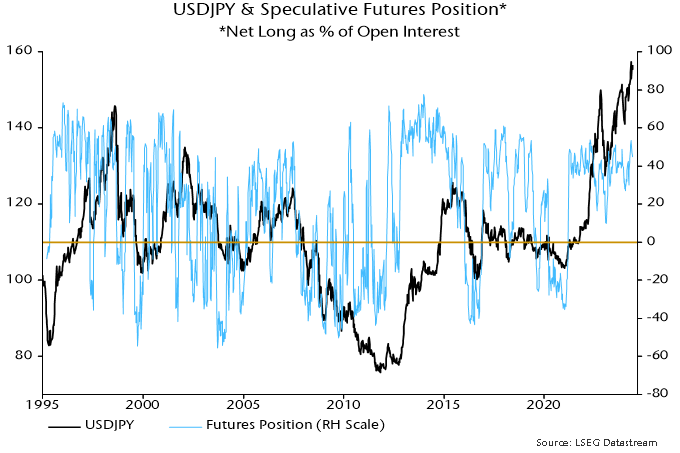
US futures data show that speculators (i.e. non-commercials) have been (correctly) long the dollar since March 2021, i.e. for three years and two months. The record unbroken long position occurred between 2012 and 2016, lasting three years and three months before a major reversal – chart 6.
Chart 6
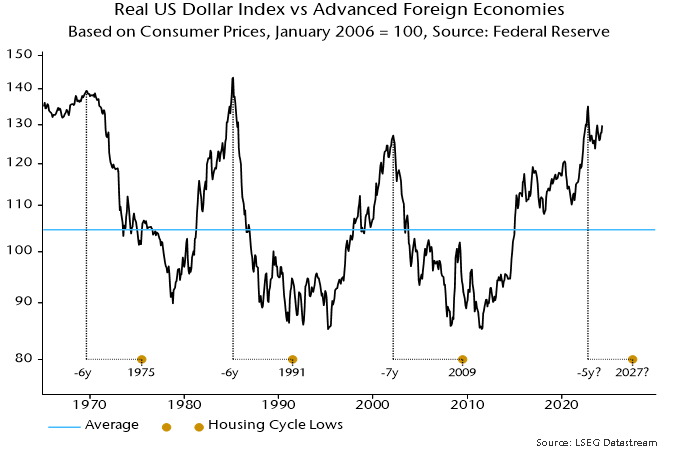
The Fed’s real dollar index against advanced foreign economies peaked in October 2022 at a 29% deviation from its long-run average, within the range at secular tops in August 1969, March 1985 and February 2002 – chart 7**. Those peaks occurred six to seven years before lows in the 18-year (average length) housing cycle. The dollar trended lower into and beyond those cycle troughs. Assuming a normal cycle length, another such low is scheduled for the late 2020s.
Chart 7
*The BoJ index starts in 1970; earlier numbers were estimated using data on the nominal effective rate and Japanese / G7 consumer prices.
**The Fed index starts in 1973; earlier numbers were estimated using data on the nominal effective rate and US / G7 consumer prices.