Money & Cycles Weekly Bulletin
More grounds for Fed tightening
May 18, 2026 by Simon Ward
- US CPI / PPI data surprised unfavourably, inflation expectations are firming and broad money growth is too strong (see charts).
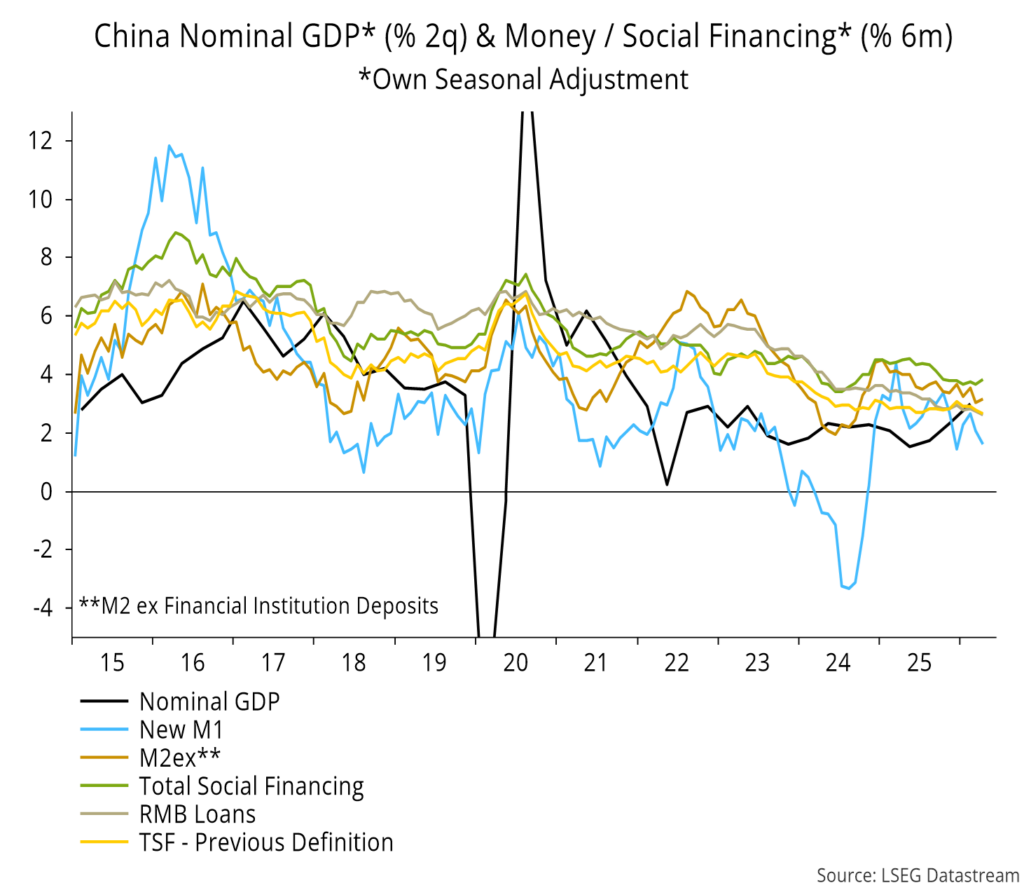
- Chinese money / credit growth, by contrast, has cooled, arguing for policy easing to offset a likely export slowdown (see charts).
- An excessive pace of QT continues to drag down Japanese money growth while contributing to upward pressure on JGB yields (see charts).
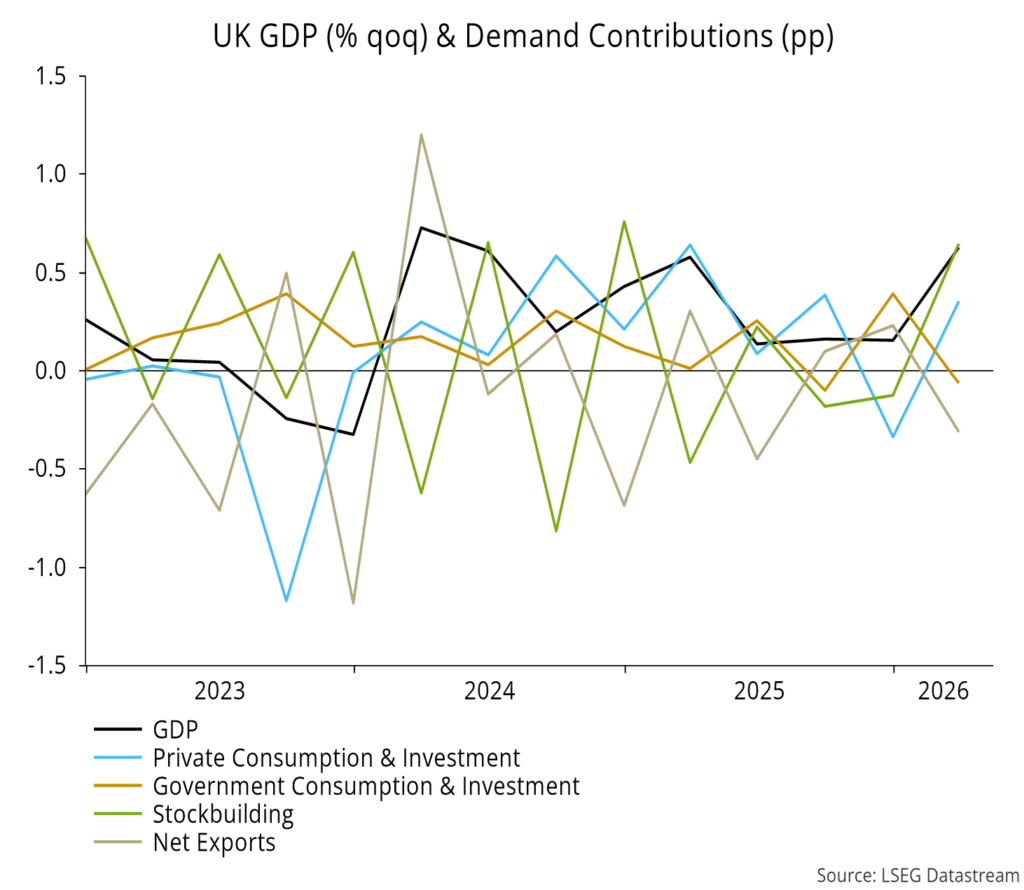
- Strong Q1 UK GDP growth is likely another head fake, being driven mainly by a surge in stockbuilding (see charts).
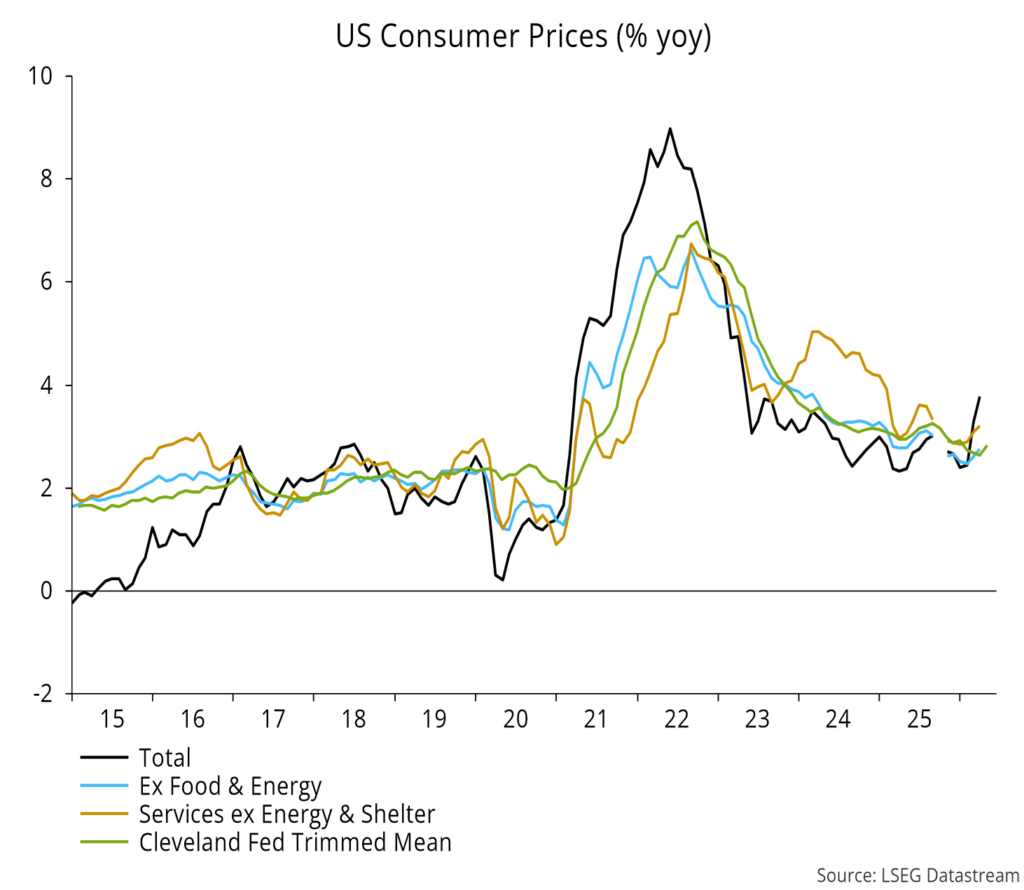
Measures of US annual core CPI inflation are inflecting higher, including “supercore” services and trimmed mean (favoured by Fed Chair Warsh):
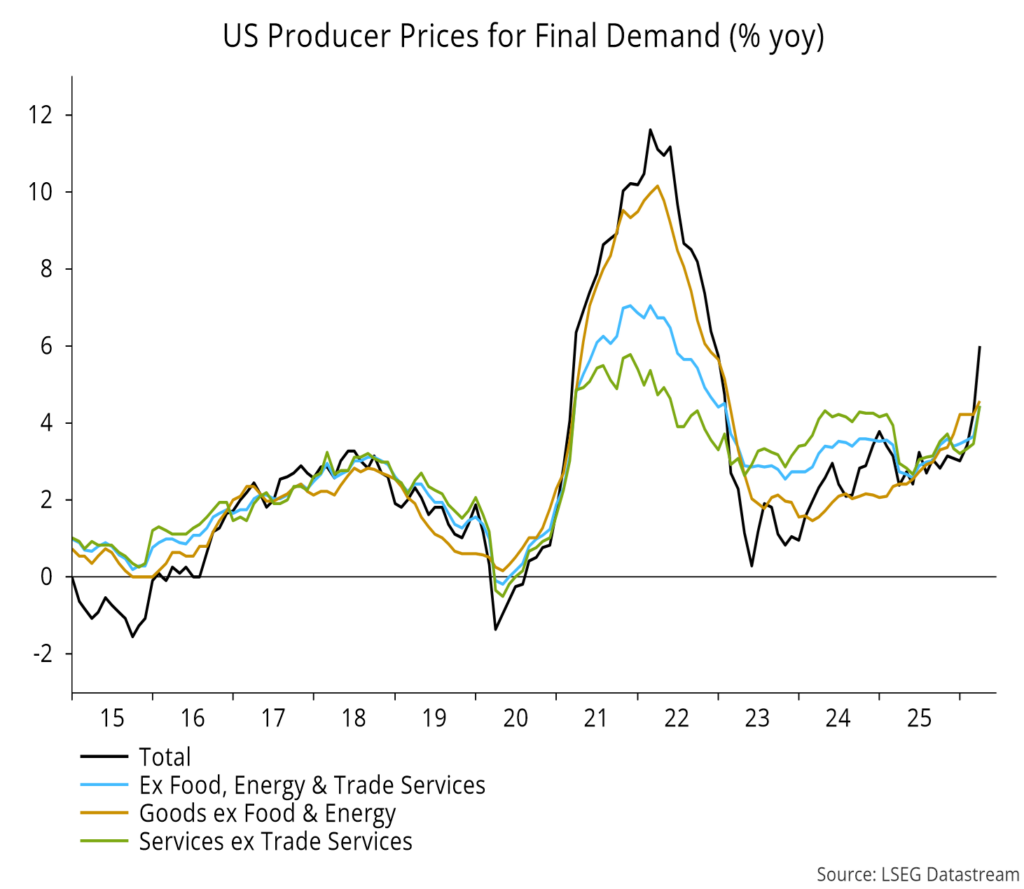
The pick-up is more pronounced in PPI data, encompassing goods and services:
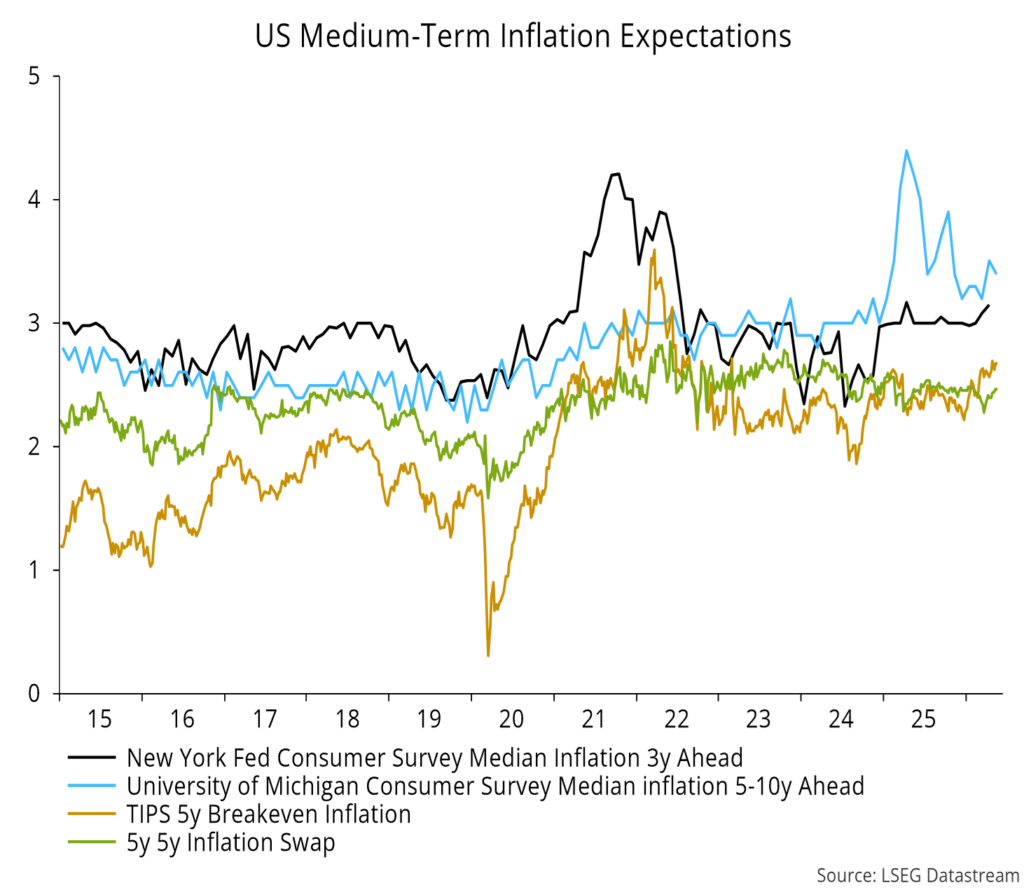
Measures of inflation expectations are firming, although the five-year five-year forward remains within the recent range:
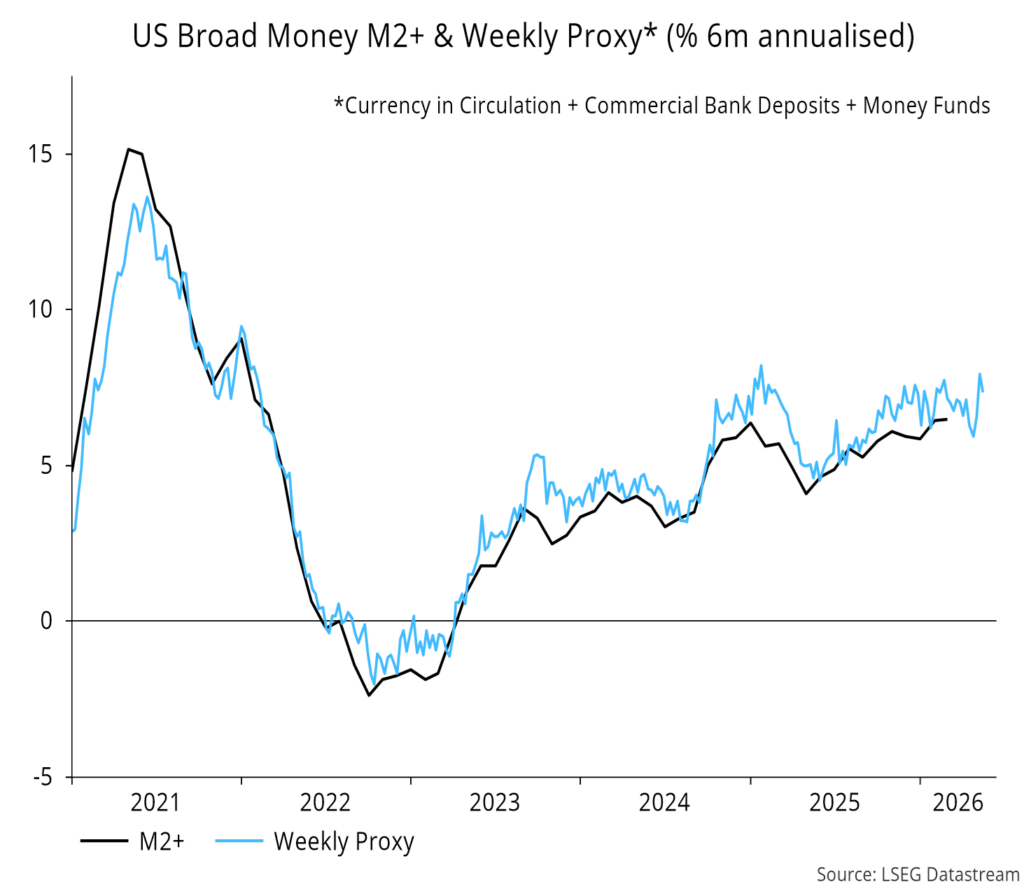
Six-month broad money growth of 6.5% annualised in March is inconsistent with the 2% inflation target, i.e. monetary conditions risk accommodating cost-push pressures from tariffs and Gulf conflict:
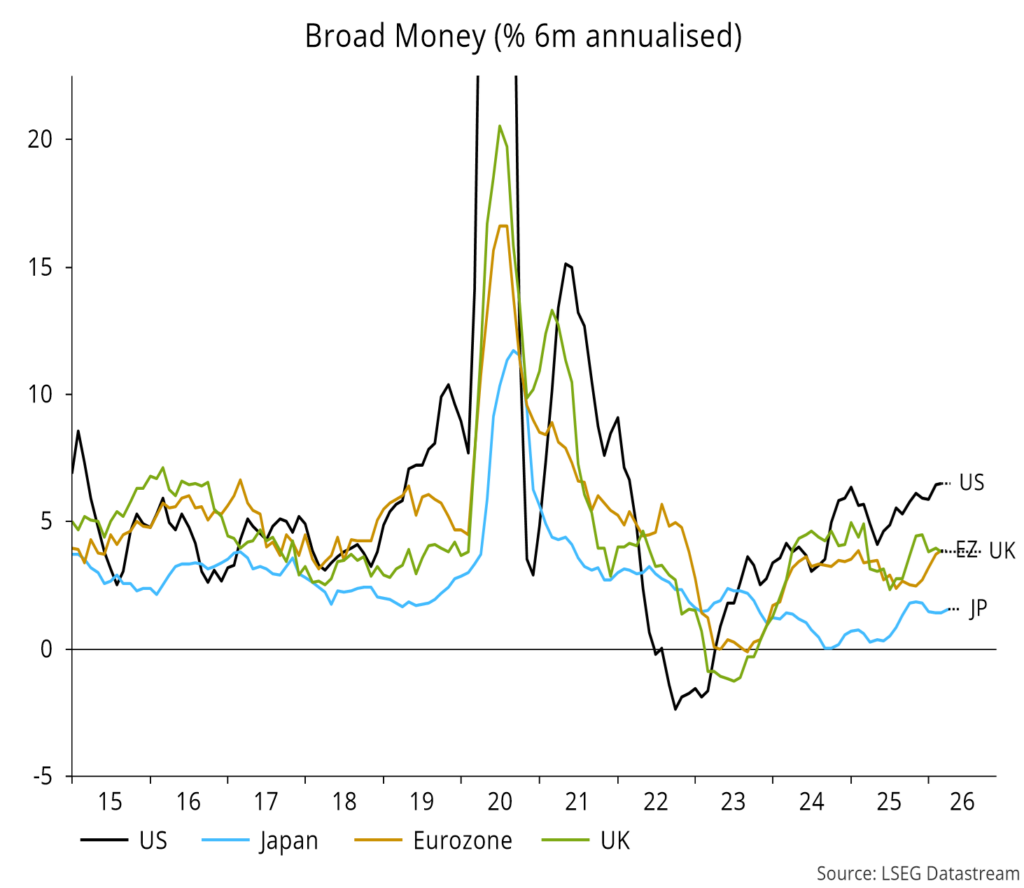
By contrast, modest / weak growth in Europe / Japan argues that current policy stances are sufficiently counter-inflationary.
Strong money growth appears to have been sustained into May, based on weekly data:
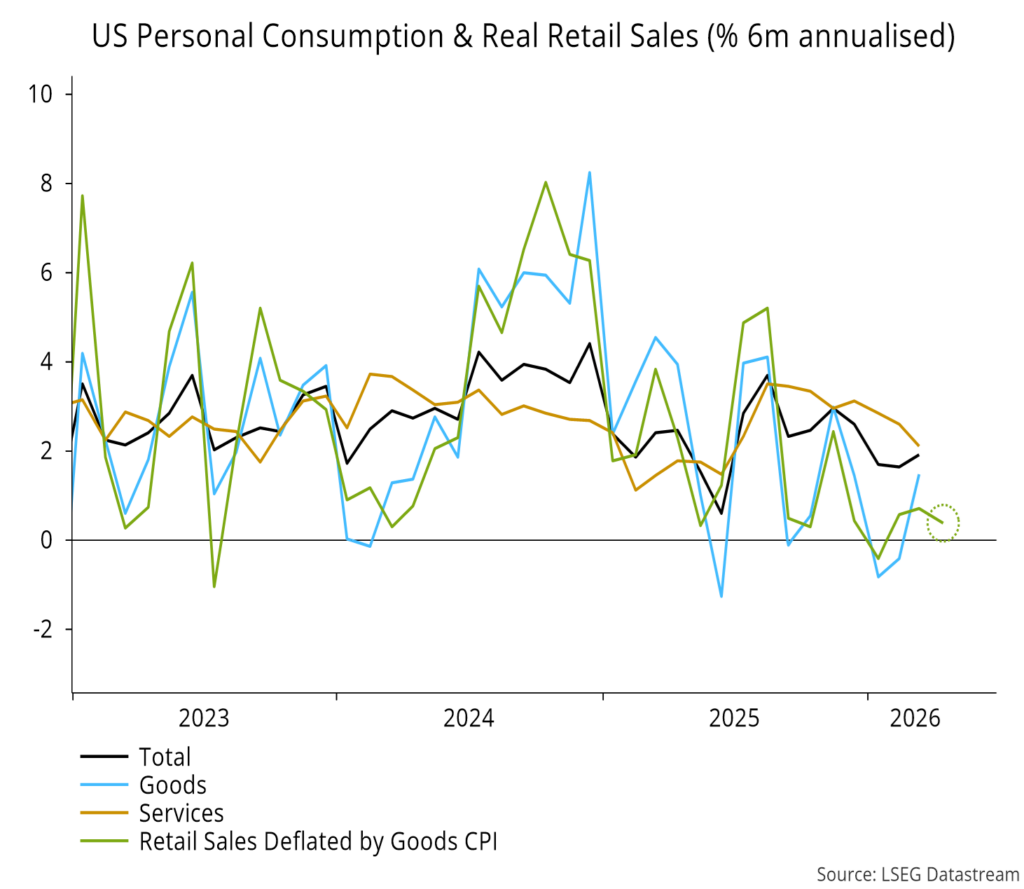
Tax refunds supported April retail sales but six-month inflation-adjusted growth remains weak:
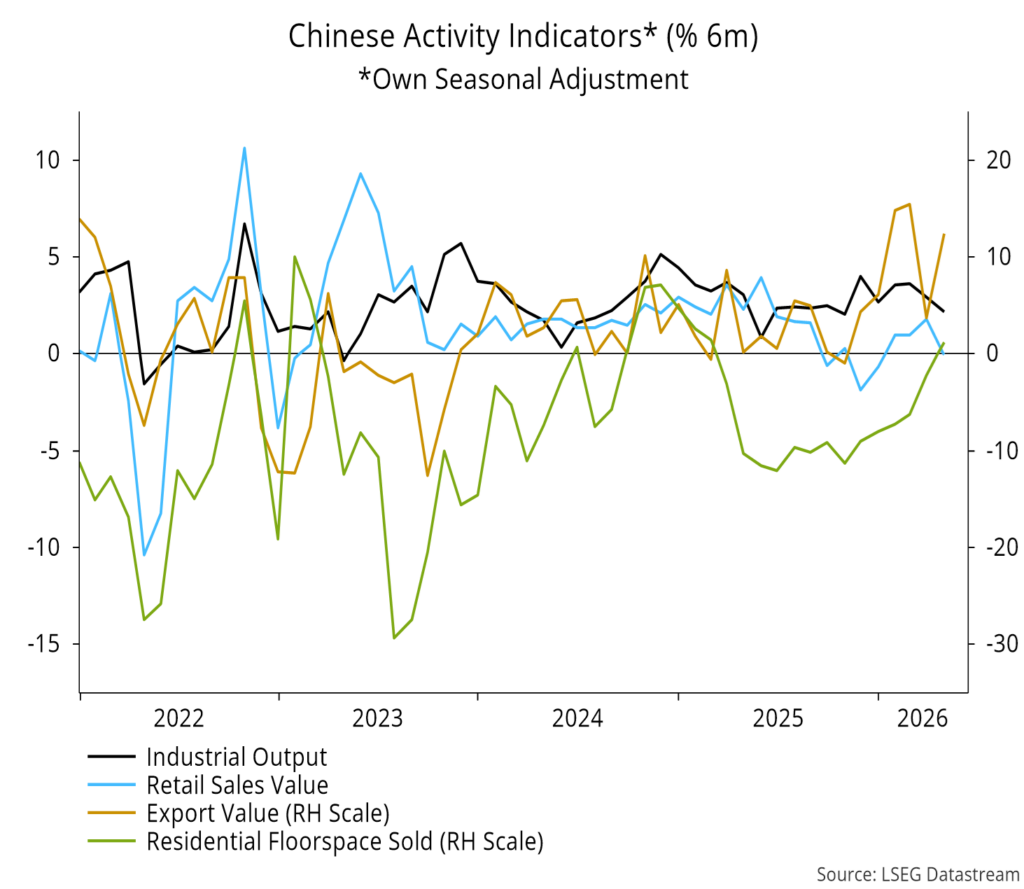
Chinese April activity numbers were disappointing, with soft domestic demand offsetting continued export strength, although home sales appear to be stabilising:
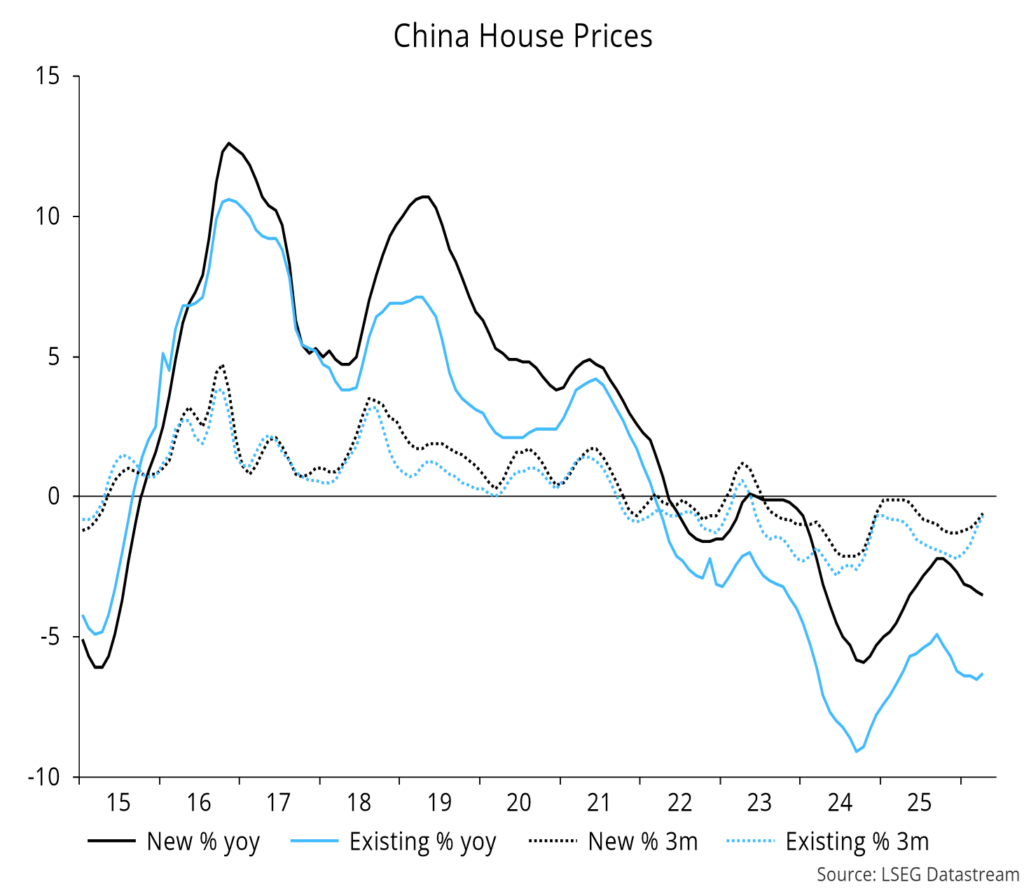
Still, home prices continue to deflate:
Six-month growth rates of money and bank lending continue to trend lower:
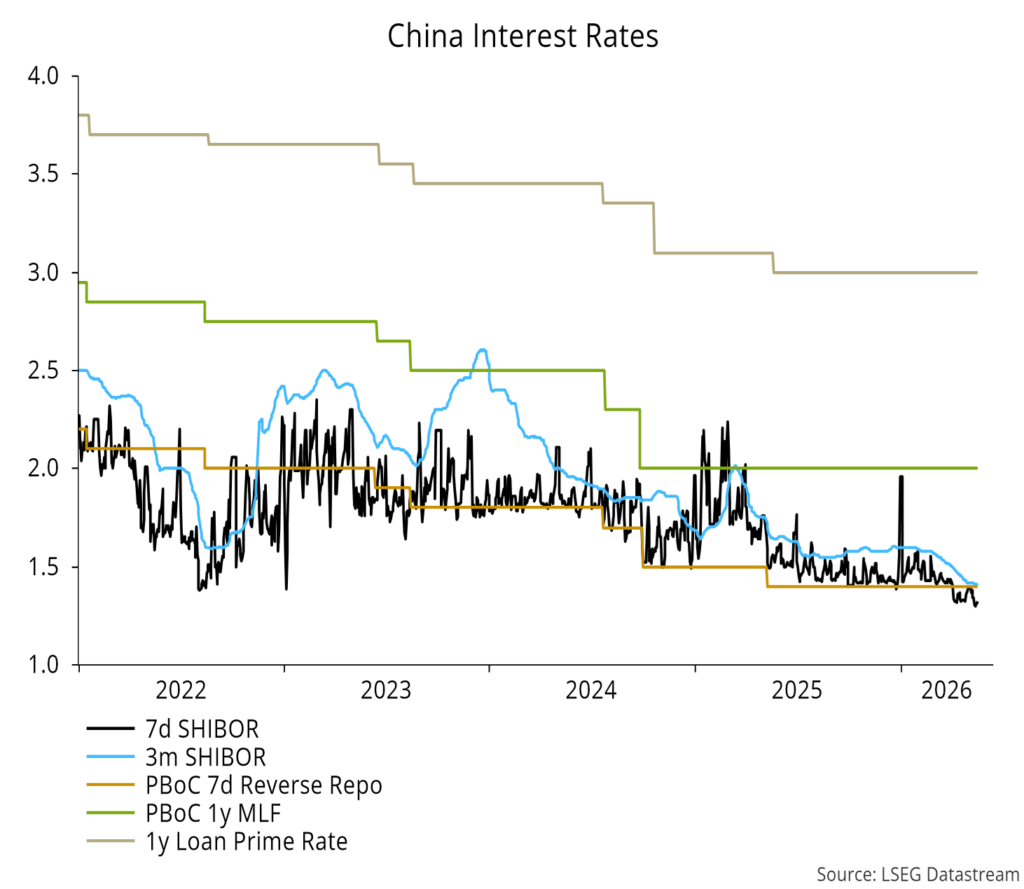
Money rates have eased further, suggesting an official rate cut soon:
Japanese money growth is off the lows but continues to be dragged down by excessive QT, which is also a key driver of the JGB sell-off:
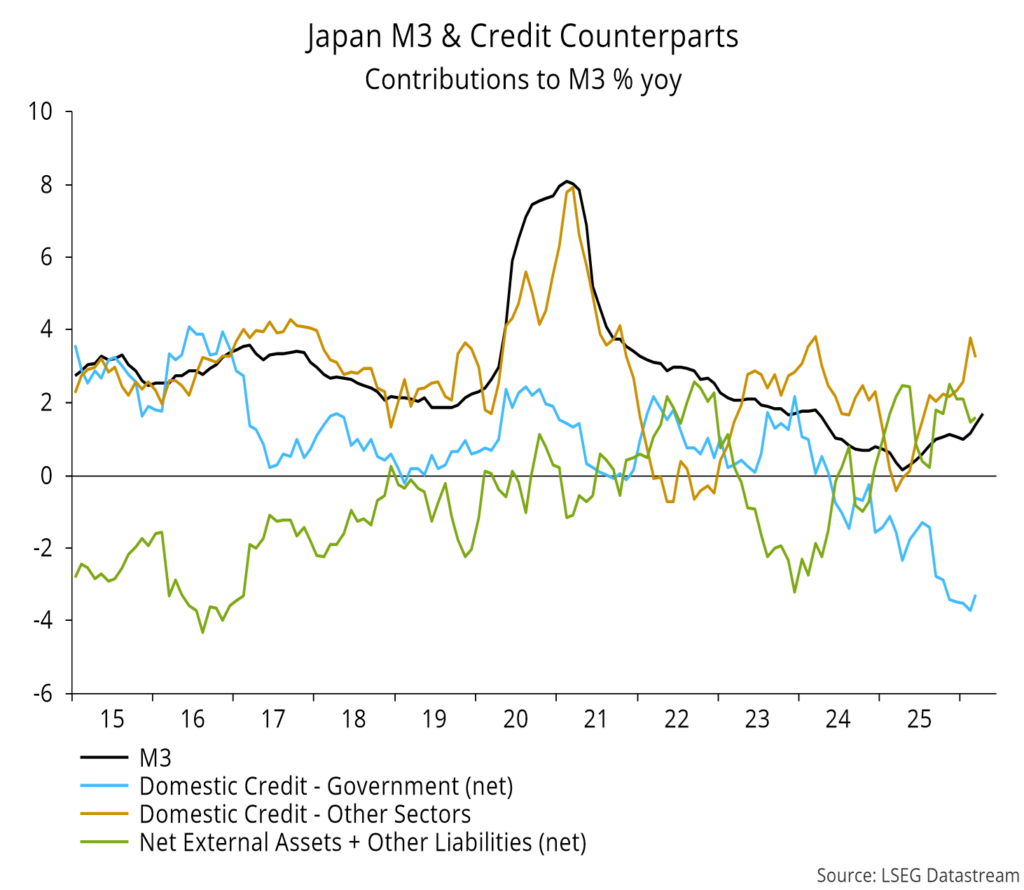
There is a case for an “operation twist”, combining an expected further rate hike with a cut-back or cessation of QT.
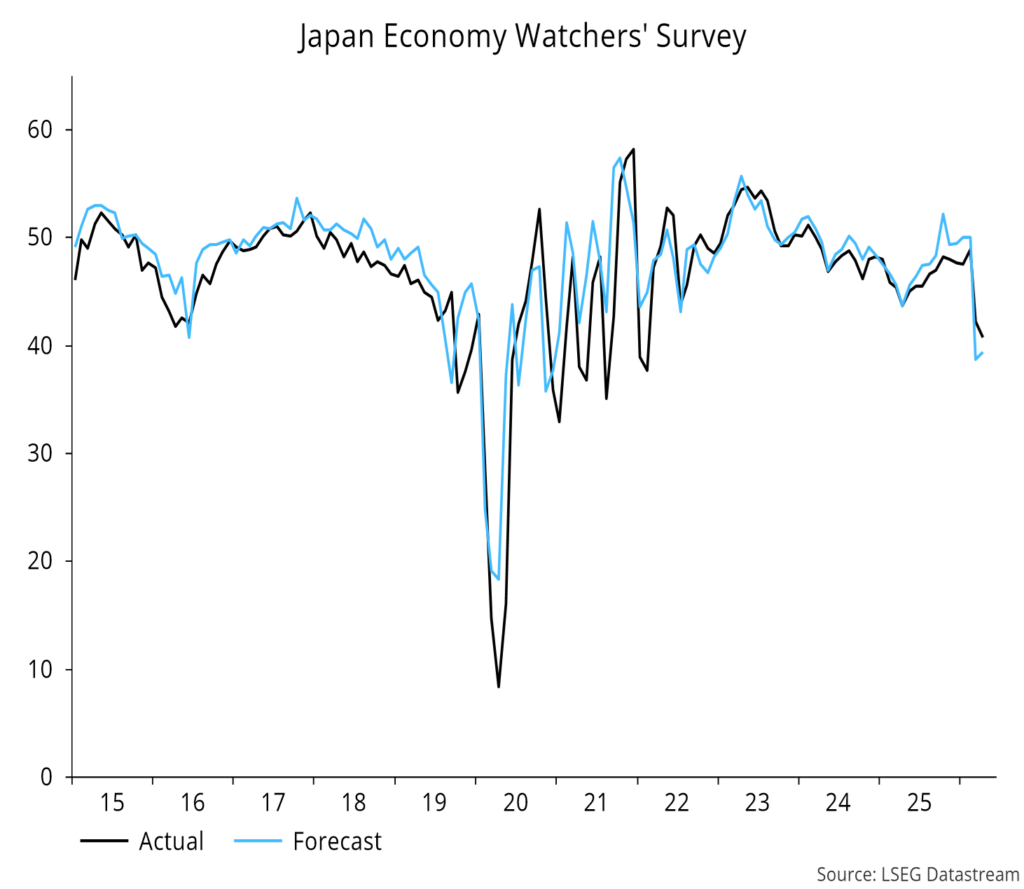
Small firms remain gloomy:
Strong Q1 UK GDP growth is likely another head fake, being driven mainly by a surge in stockbuilding:
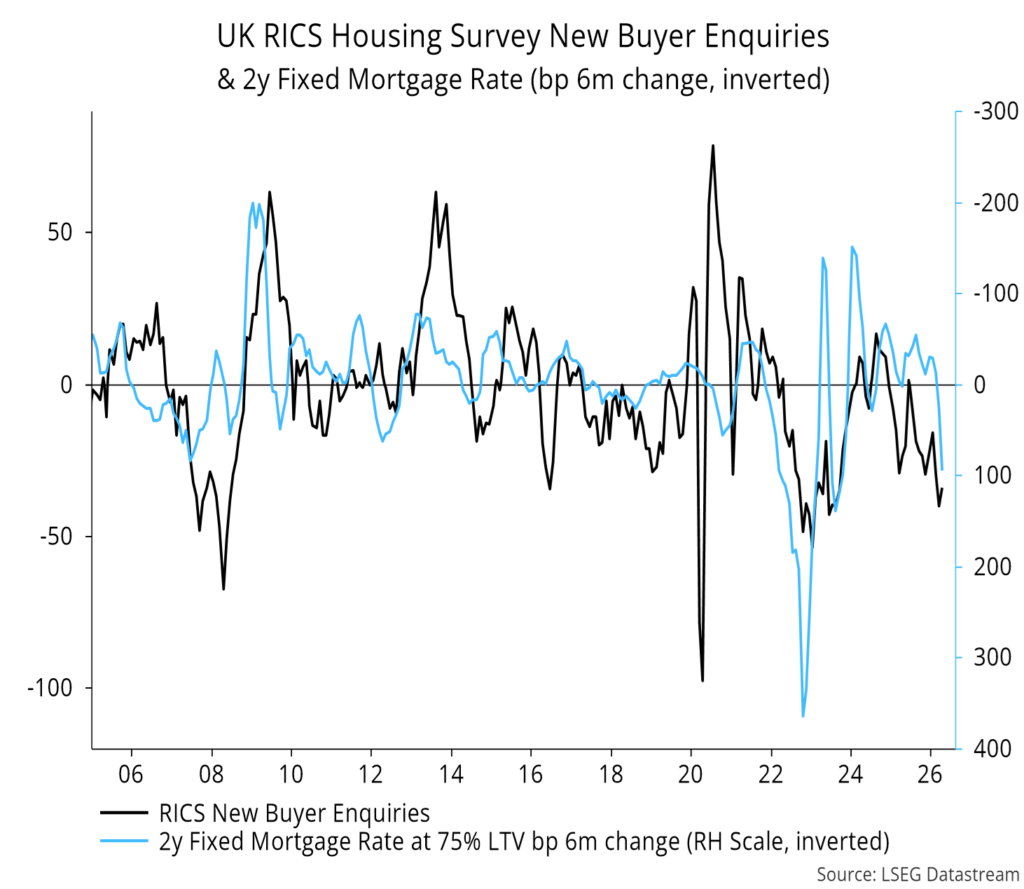
Home-buyer demand remained weak in April, with higher mortgage rates suggesting further downward pressure:
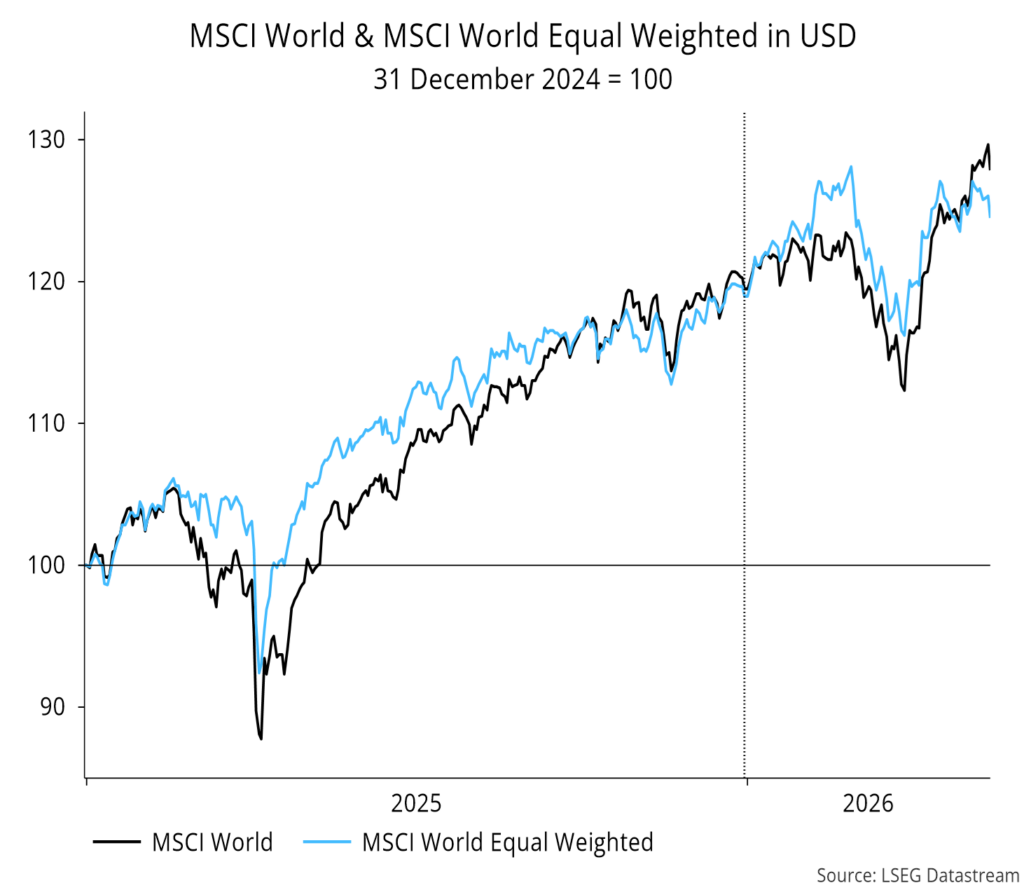
The equal-weight MSCI World index remains below its end-February high:
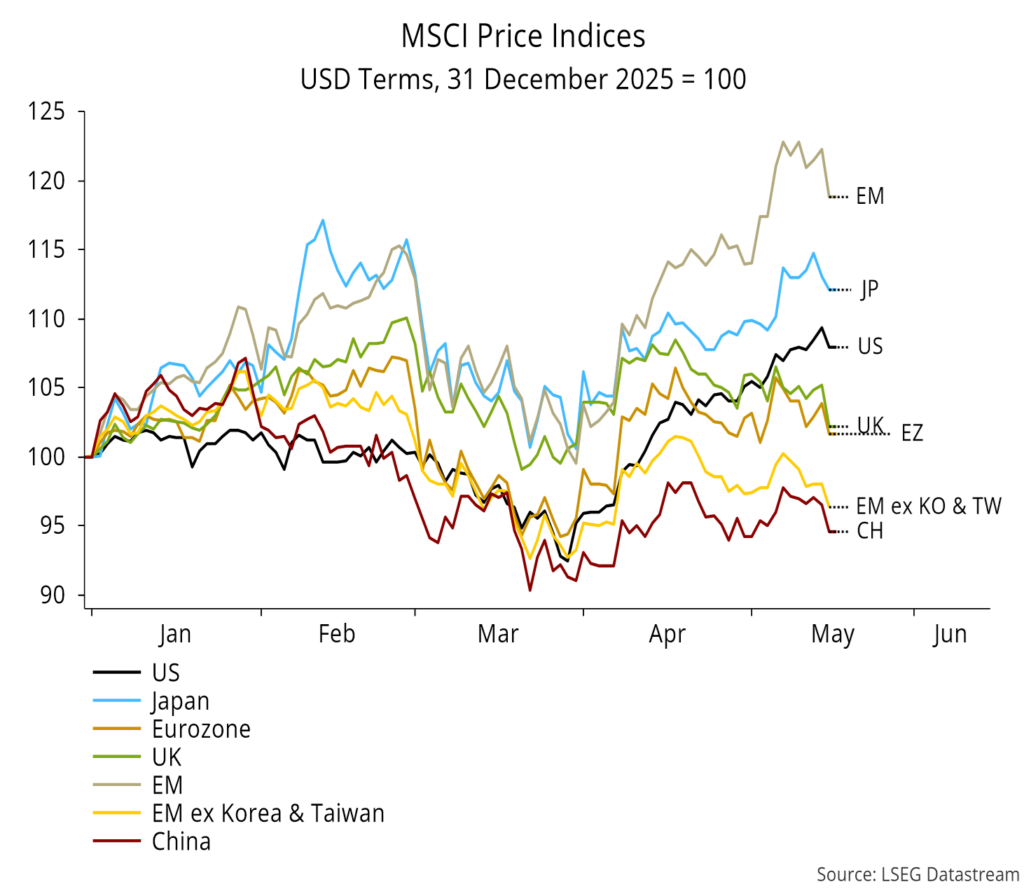
The US continues to regain relative performance:
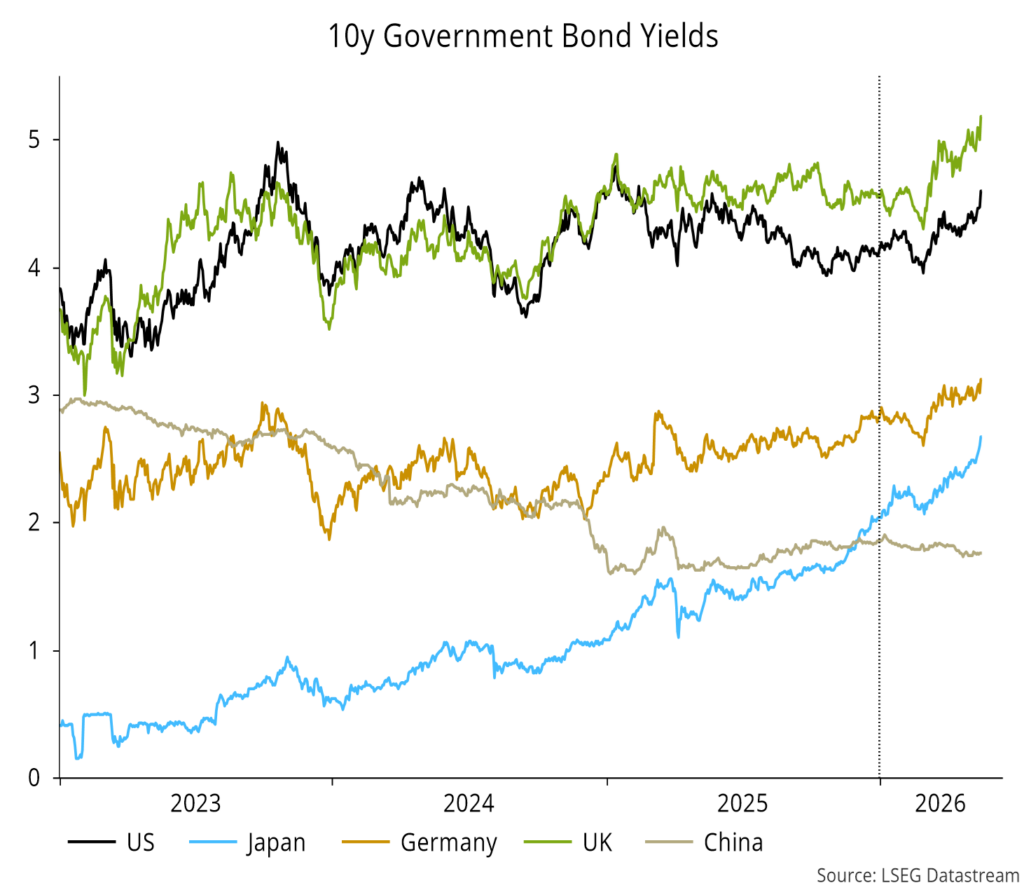
The US 10-year Treasury yield remains below 2023 / 2025 highs, in contrast to yields in Europe / Japan:
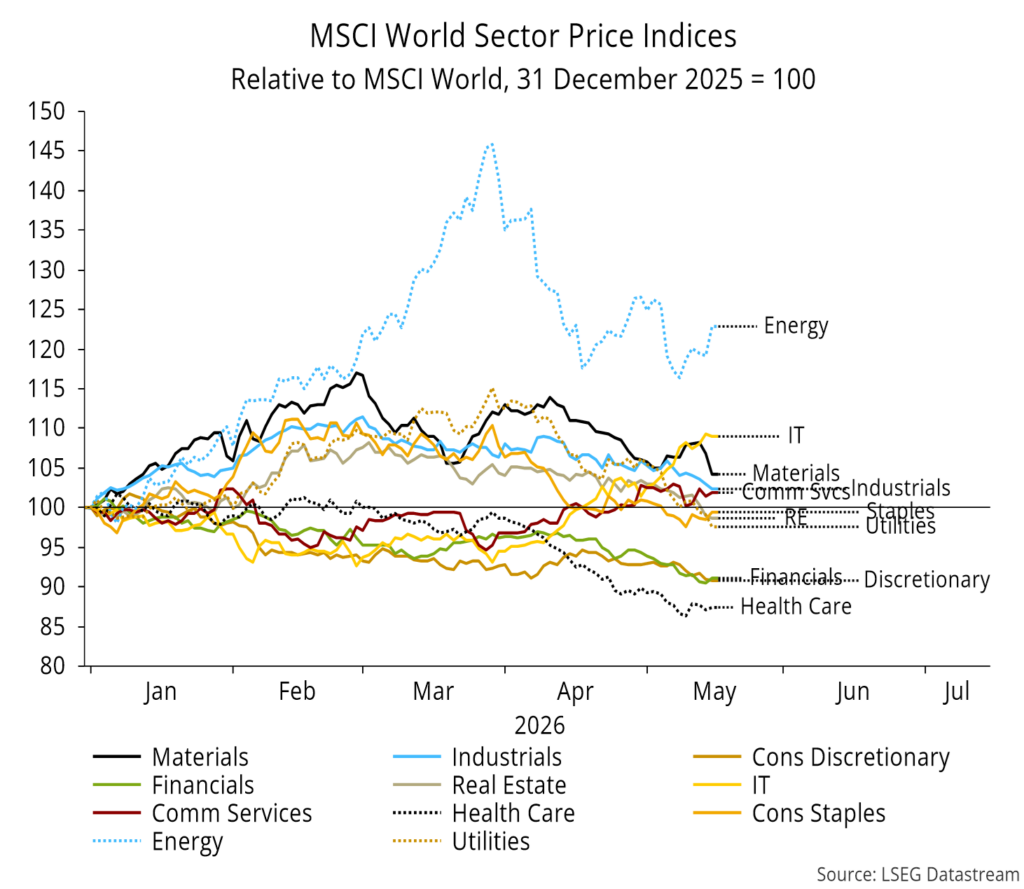
IT and energy drove the market-weight MSCI World index to a new high:


![Jean-Philippe-Lemay, CC&L FG [504x504_03]](https://ns-partners.cclgroup.com/wp-content/uploads/sites/3/2025/06/FG_-Jean-Philippe-Lemay_504x504_03.jpg)