Money & Cycles Weekly Bulletin
Stockbuilding cycle peak confirmed
April 7, 2026 by Simon Ward
-
-
-
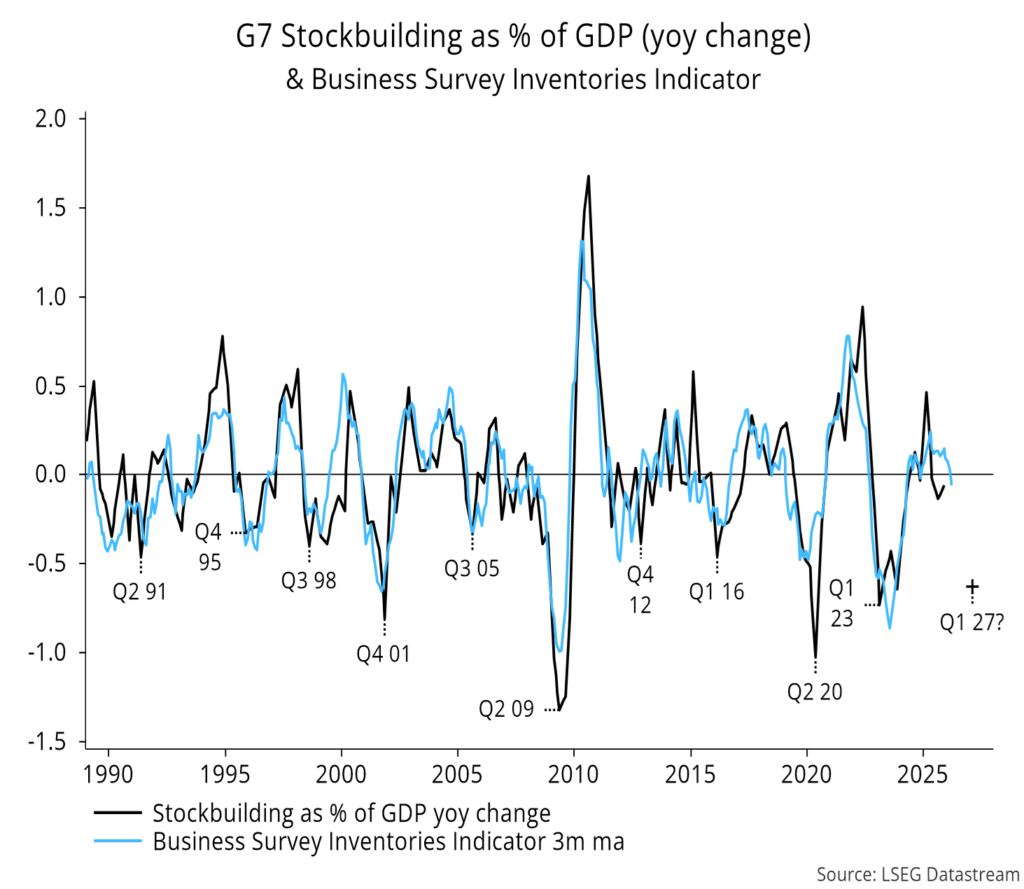
- An inventories indicator from business surveys suggests that an expected downswing in the global stockbuilding cycle is under way (see charts).
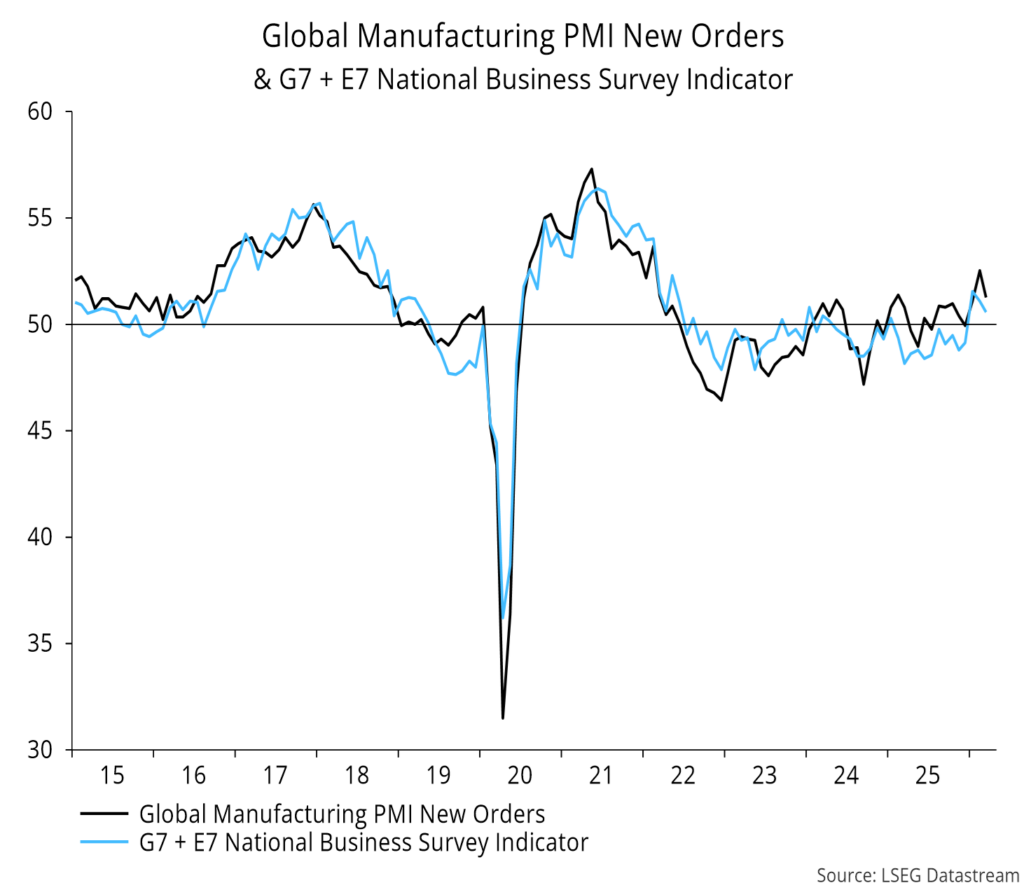
- Full data confirmed a March fall in global manufacturing PMI new orders, with the decline echoed in national surveys (see charts).
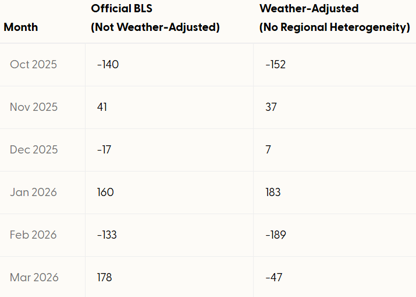
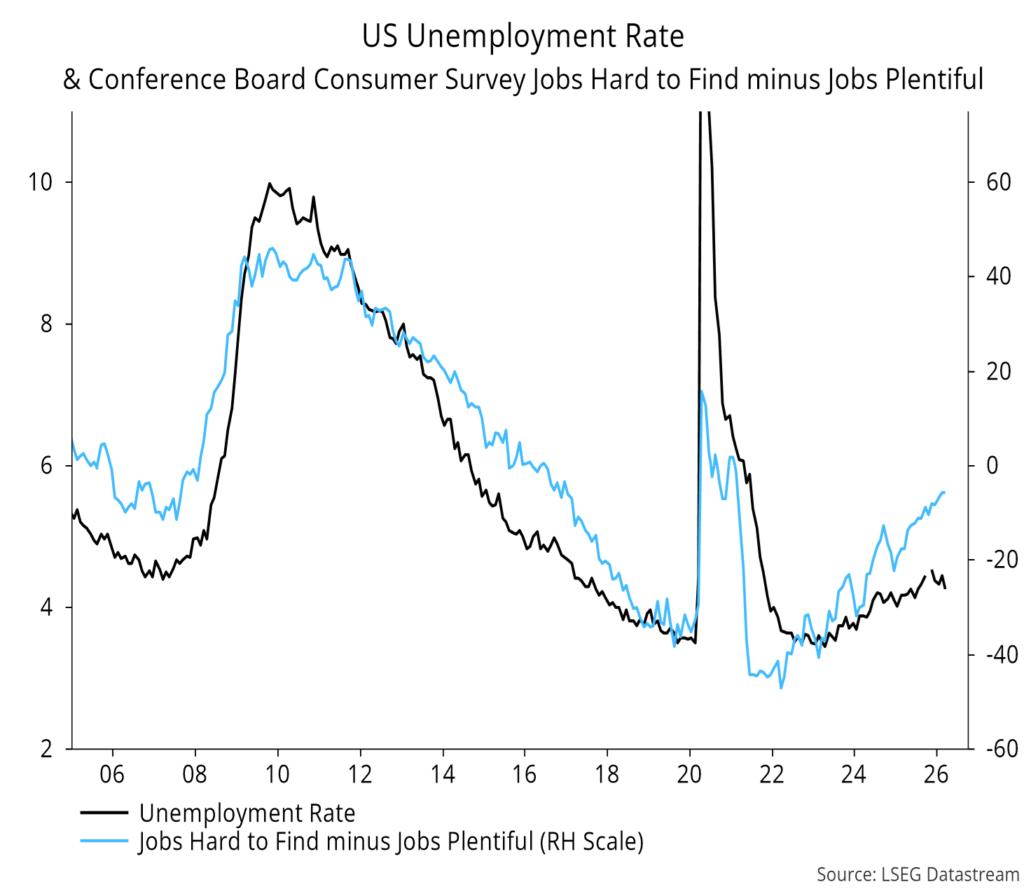
- The US March employment report likely overstates labour market resilience (see charts).
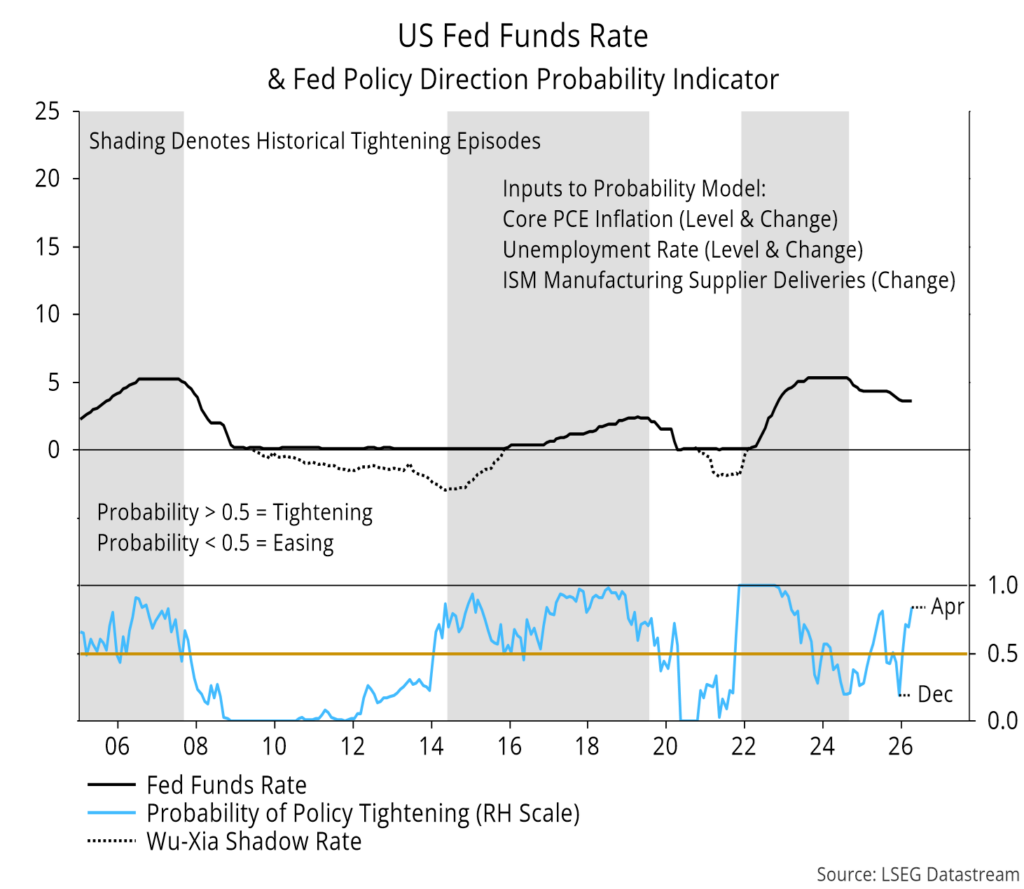
- Still, recent economic news will have reinforced Fed hawkishness, according to a simple model (see charts).
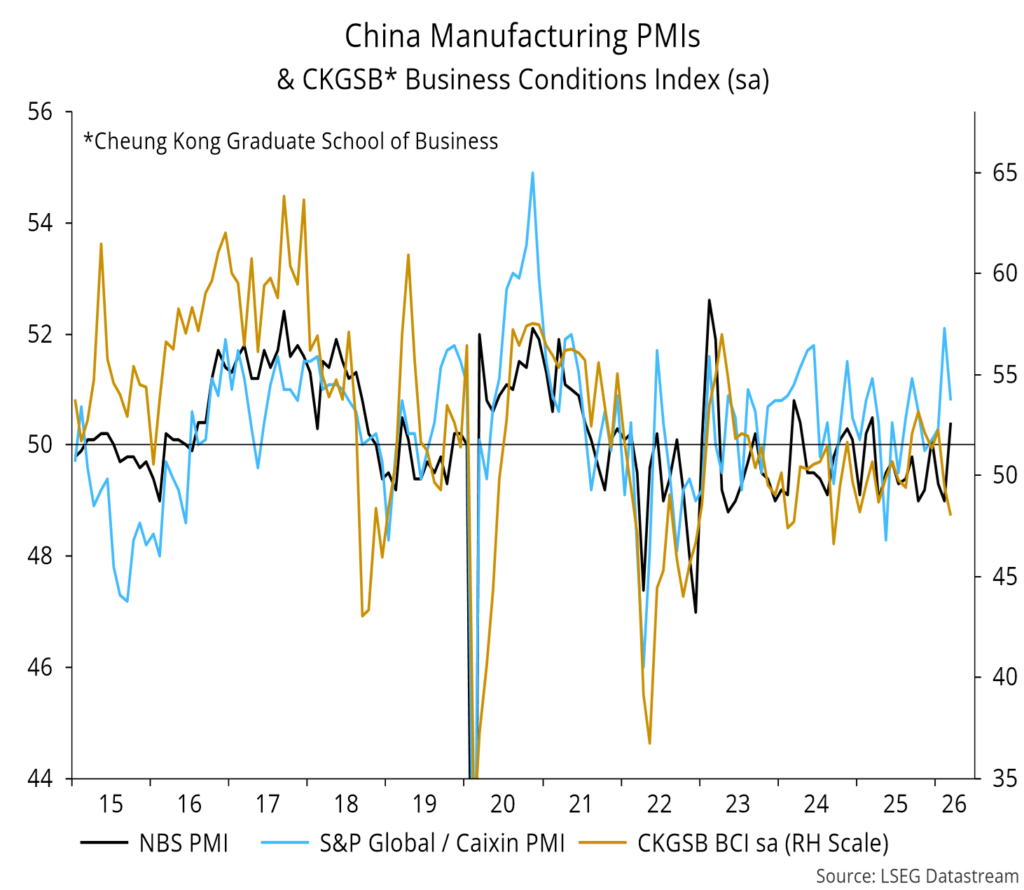
- A surprise jump in the Chinese NBS manufacturing PMI likely reflects a faulty seasonal adjustment (see charts).
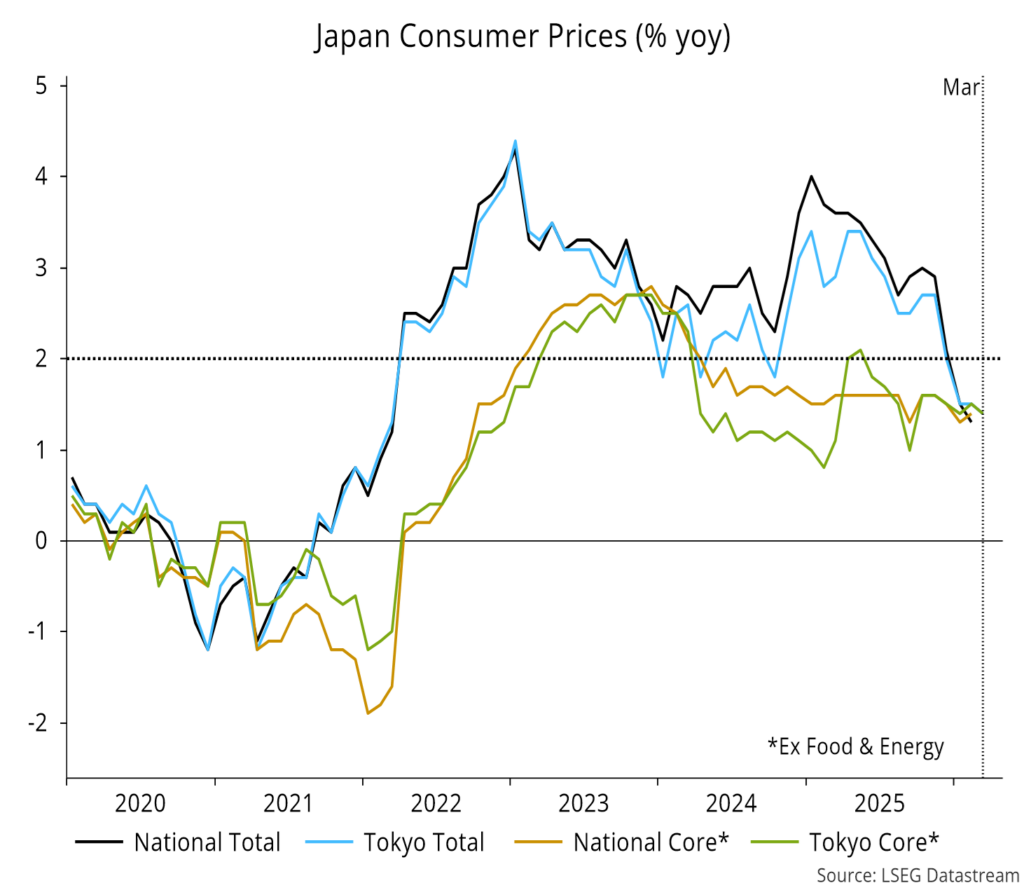
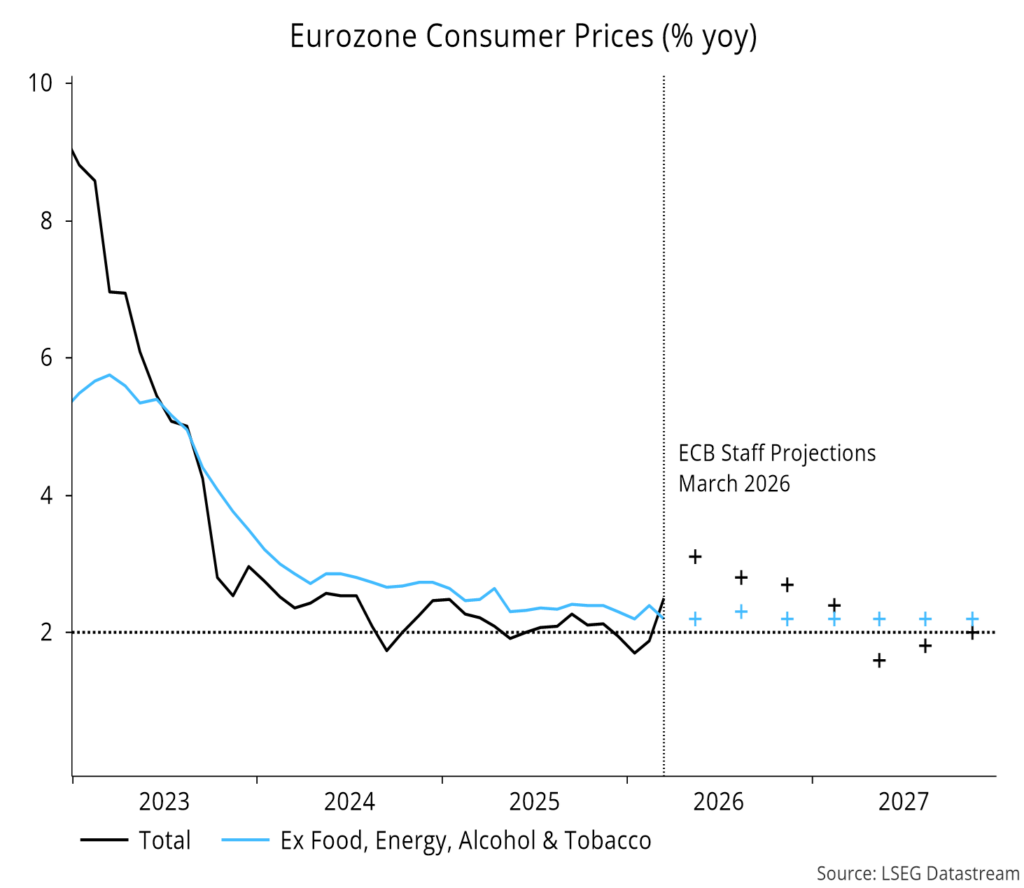
- Tokyo and Eurozone March core CPI inflation remained tame (see charts).
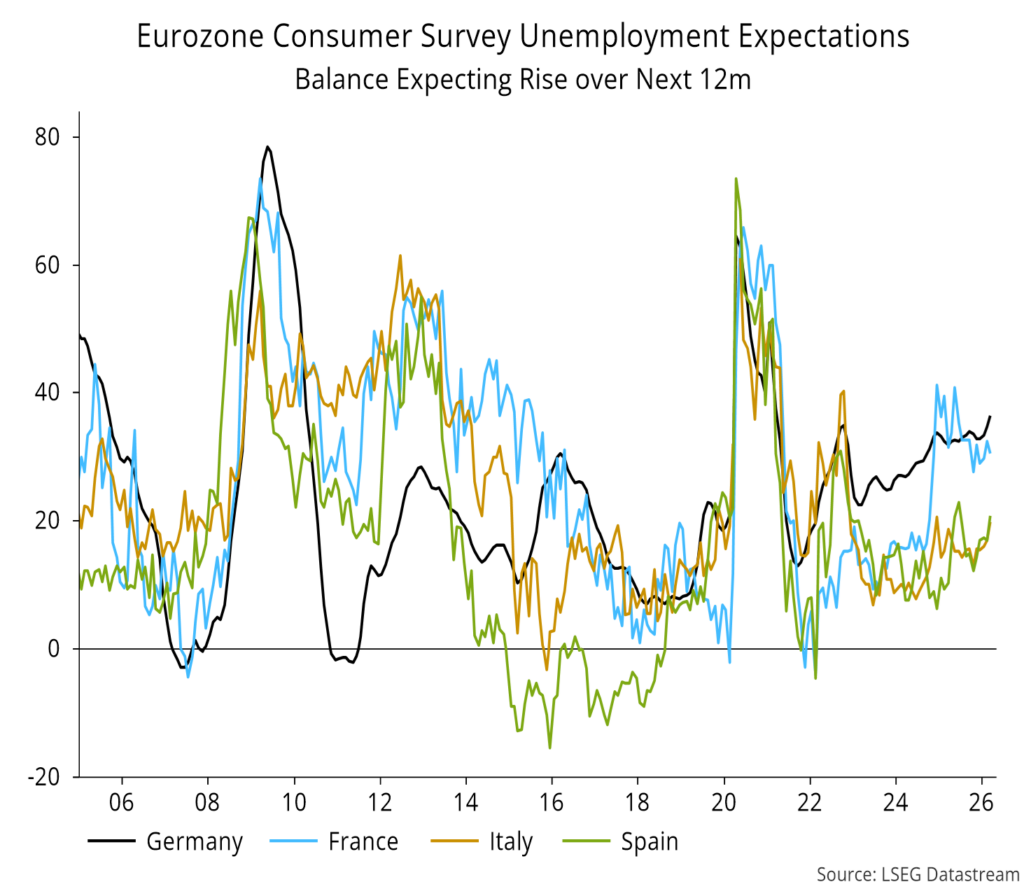
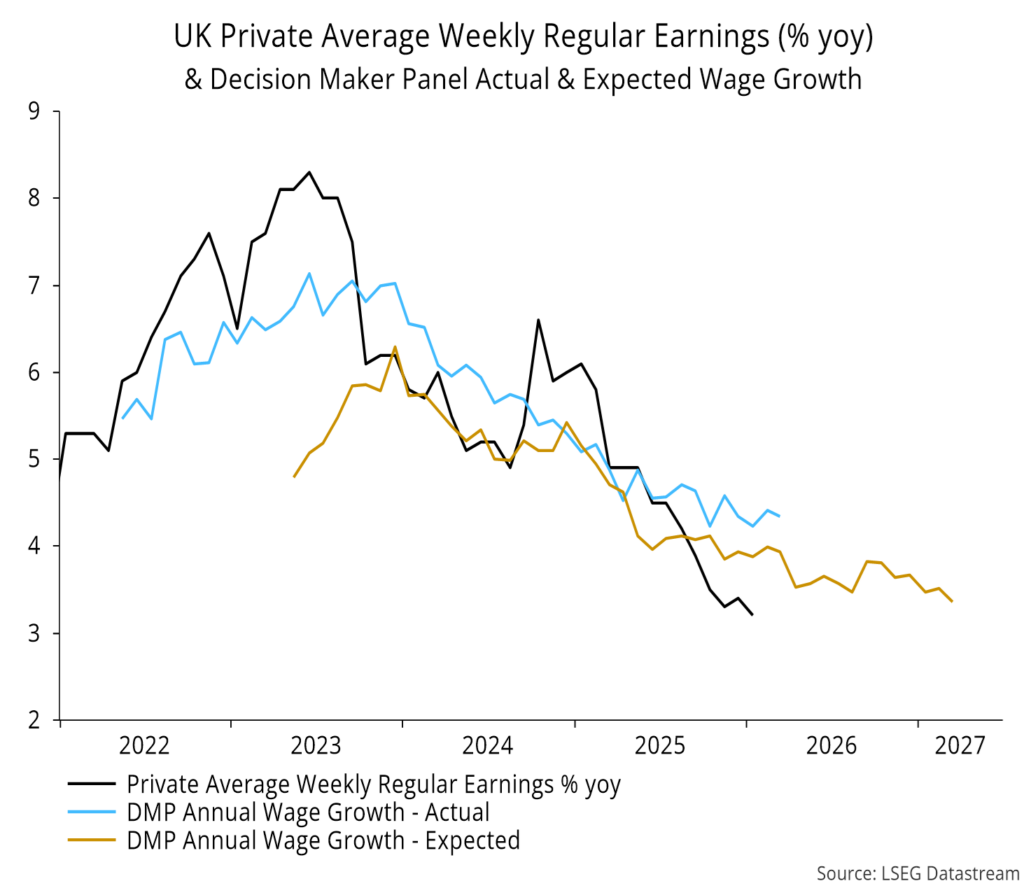
- Eurozone unemployment fears are rising, while UK wage growth expectations cooled further in the March Bank of England DMP survey (see charts).
-
-
An inventories indicator from business surveys fell below zero, suggesting that an expected downswing in the global stockbuilding cycle is under way:
This suggests further underperformance of cyclical sectors into the cycle low, possibly in Q1 2027:
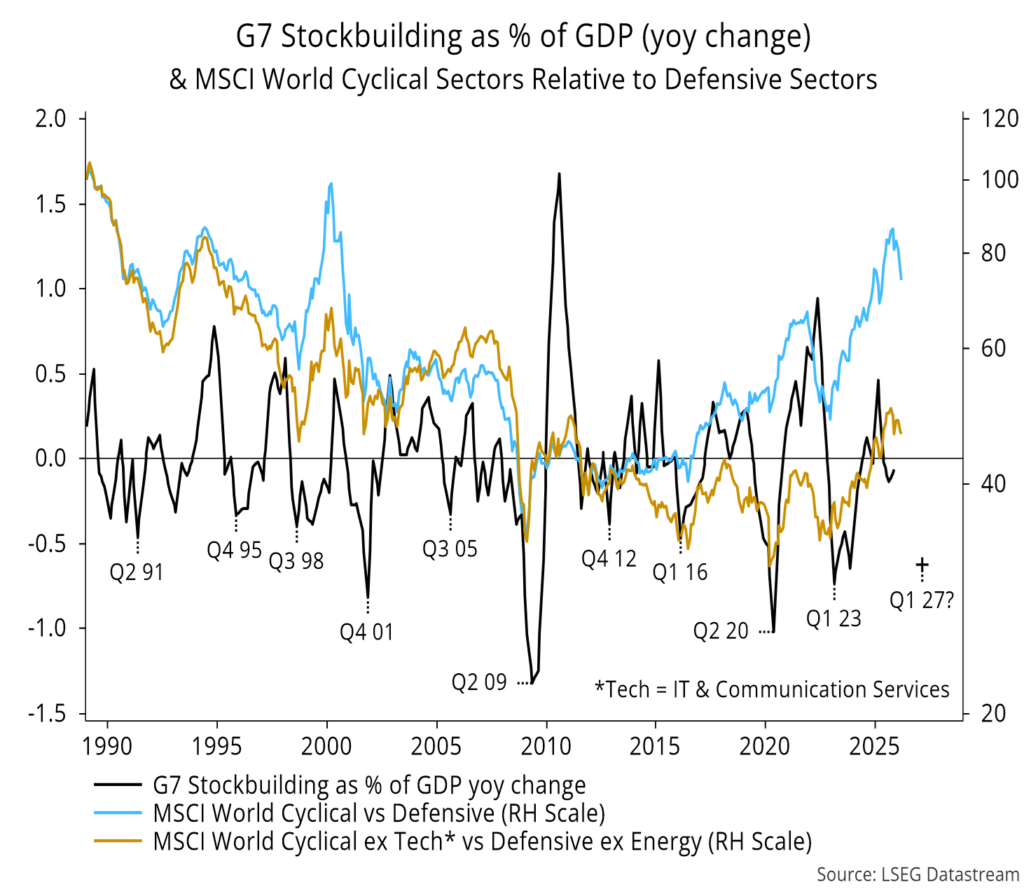
Suggestion: use any rally on favourable Gulf War news to reduce exposure.
Full data confirmed a March fall in global manufacturing PMI new orders, with the decline echoed in national surveys (ISM for US, NBS for China, Ifo for Germany etc):
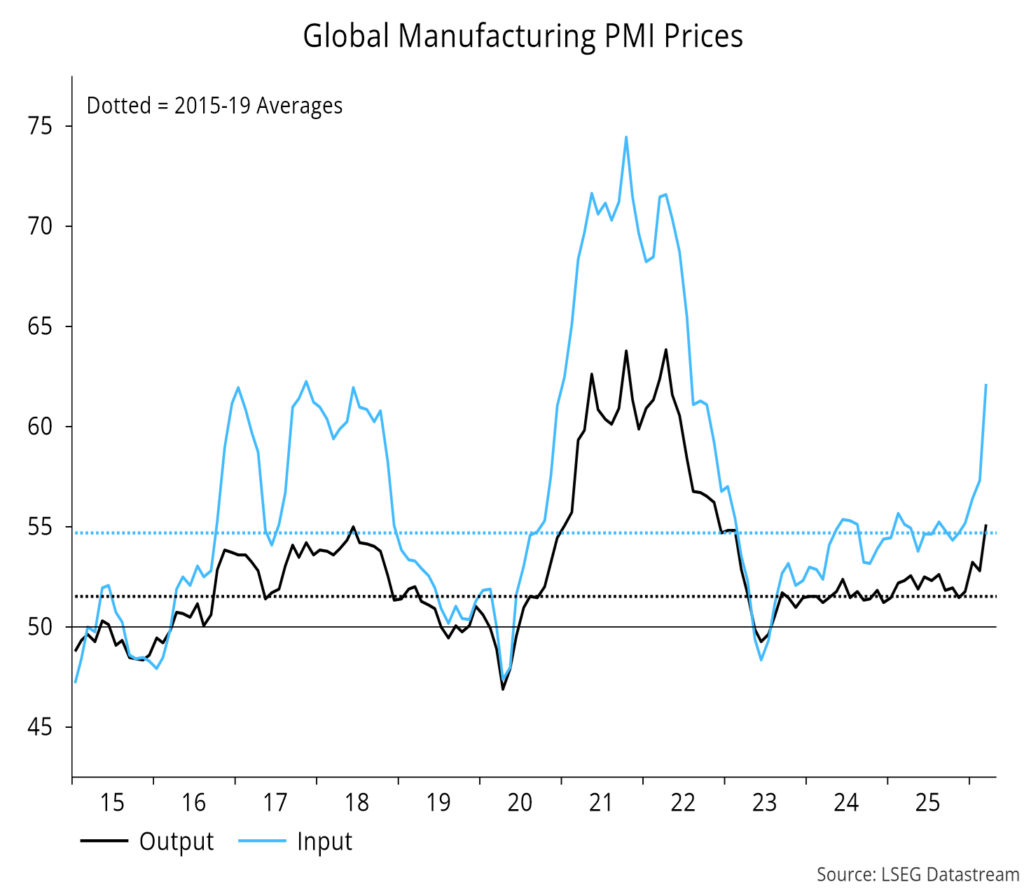
Manufacturers are trying to pass on surging input costs:
US payrolls growth beat expectations but was flattered by favourable weather effects, according to San Francisco Fed analysis (h/t Mike Green):
Similarly, a fall in the unemployment rate is at odds with a further increase in consumer bearishness about the labour market:
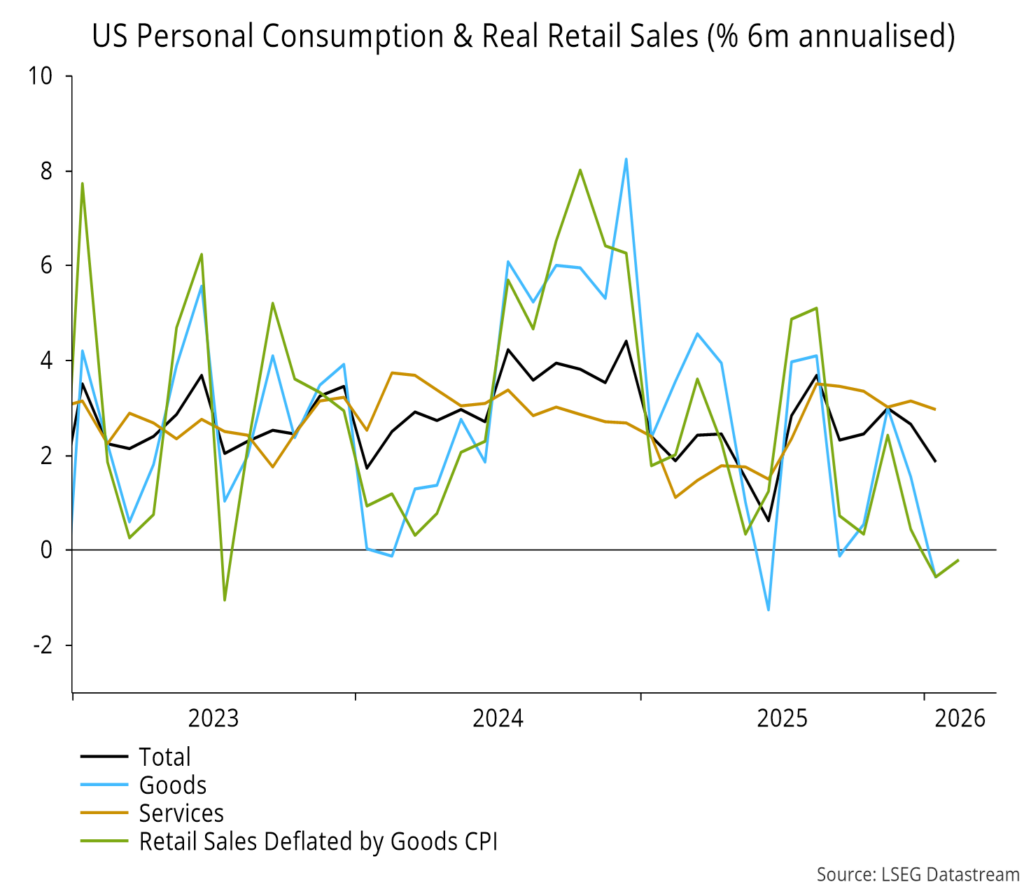
Retail sales rose solidly in February but the six-month real rate of change remained negative:
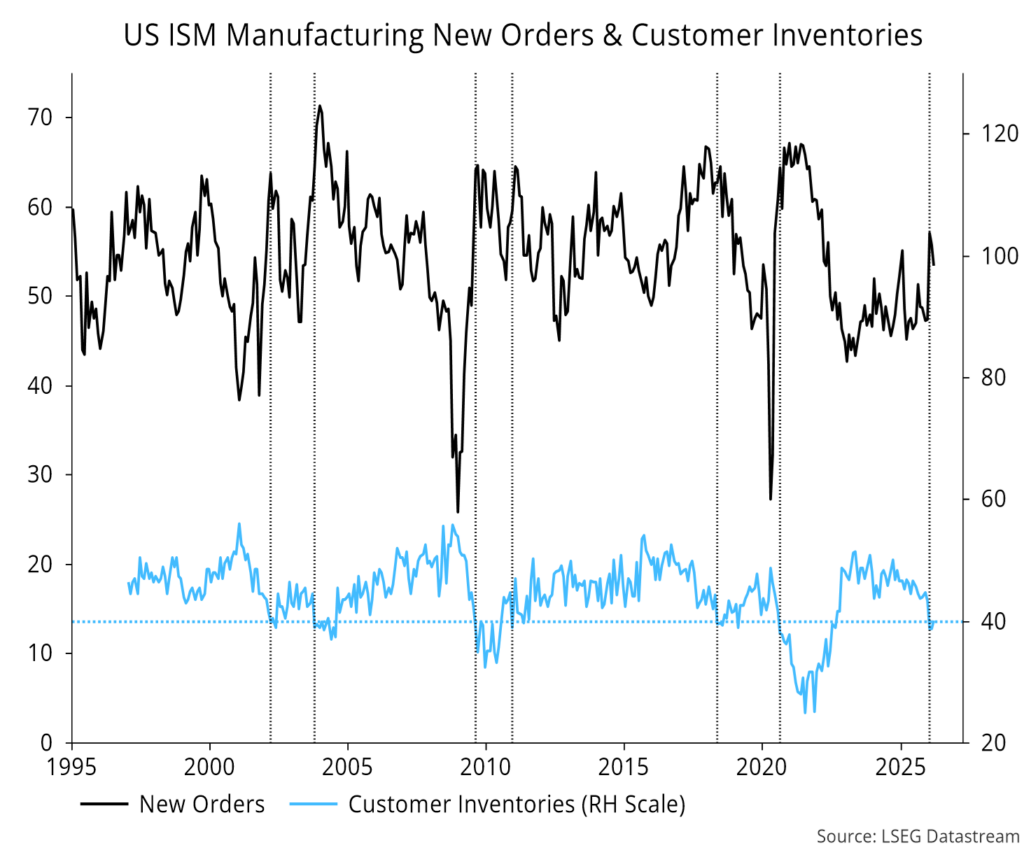
ISM manufacturing new orders fell back, as had been signalled by the customer inventories index moving below 40:
Delivery delays surged, partly reflecting Gulf War disruption:
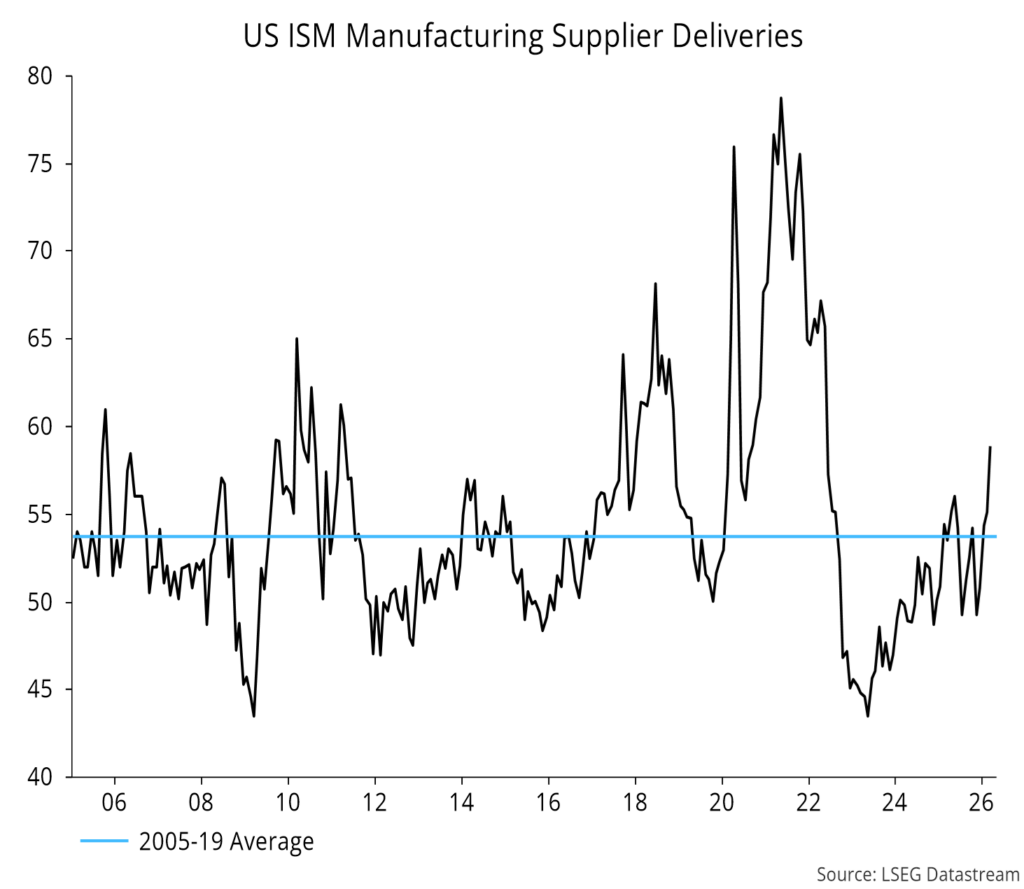
The fall in the unemployment rate and rise in ISM supplier deliveries pushed a simple model of the Fed’s historical reaction function further into the tightening zone:
The Chinese NBS manufacturing PMI rose sharply in March, in contrast to weaker S&P Global and Cheung Kong surveys:
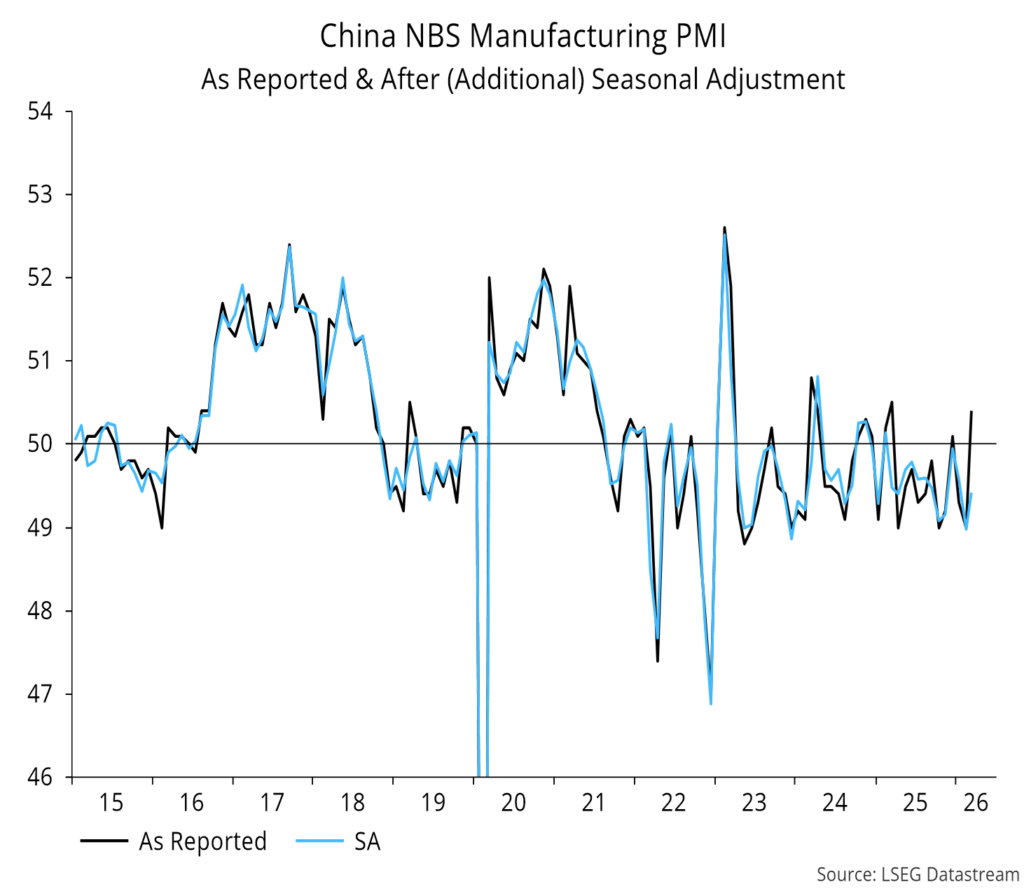
The NBS PMI is supposedly seasonally adjusted but shows a strong tendency to increase in March, suggesting a much smaller underlying rise, with the “true” index level remaining below 50:
Tokyo March annual CPI inflation – an early guide to national numbers – remained tame:
So did Eurozone core inflation, while an energy-driven rise in headline is consistent with the ECB staff’s central case forecast:
Consumer unemployment expectations picked up further in Germany, Italy and Spain while remaining elevated in France:
UK wage growth expectations cooled further in the March Bank of England DMP survey, possibly contributing to Governor Bailey walking back prior hawkish messaging:


![Jean-Philippe-Lemay, CC&L FG [504x504_03]](https://ns-partners.cclgroup.com/wp-content/uploads/sites/3/2025/06/FG_-Jean-Philippe-Lemay_504x504_03.jpg)