Money Moves Markets
Is services resilience about to crumble?
June 12, 2023 by Simon Ward
Global growth optimists expect continued solid services sector expansion to offset manufacturing weakness. PMI results for May appear, on first inspection, to support this view: services activity and new business indices rose further to 18- and 22-month highs respectively even as manufacturing new orders remained stalled below 50 – see chart 1.
Chart 1
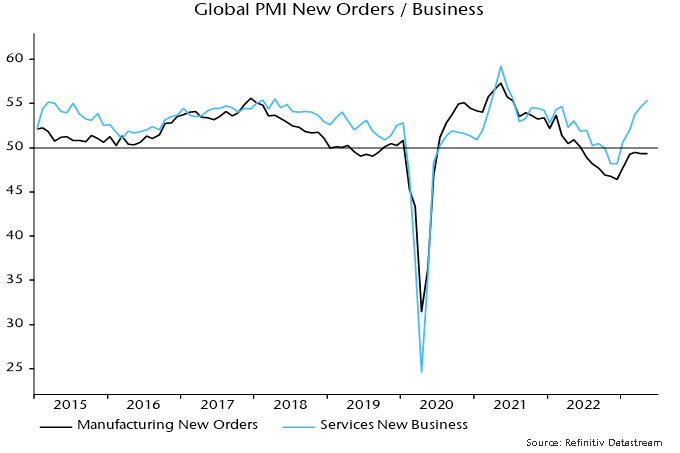
There are, however, several reasons for discounting the strong headline services readings.
First, backlogs of services work fell sharply to a four-month low despite stronger new business – chart 2. This suggests that current output is running ahead of incoming demand, in turn implying a future adjustment lower unless demand picks up further.
Chart 2
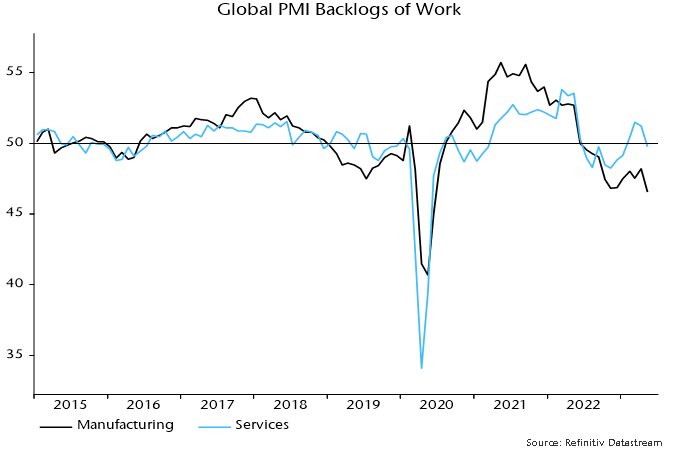
Manufacturing backlogs also fell sharply last month, breaking below their November 2022 low.
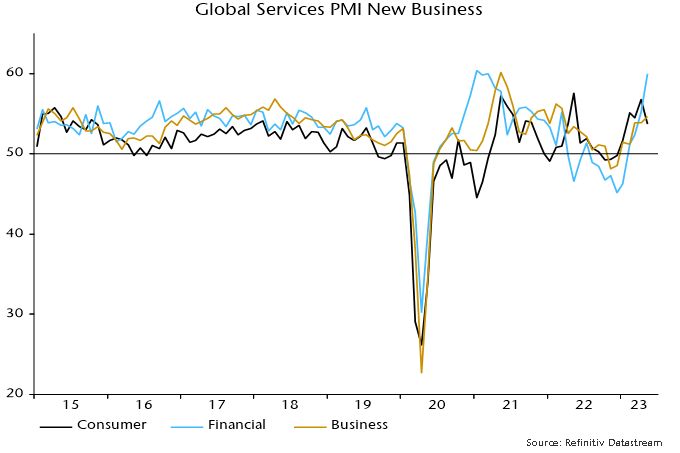
Secondly, the sectoral breakdown of the activity and new business indices shows that May rises were driven by a surge in financial services – chart 3. Consumer services indices eased on the month. Financial services strength is difficult to understand given monetary stagnation, slowing bank lending and flat trading volumes, so may prove short-lived.
Chart 3
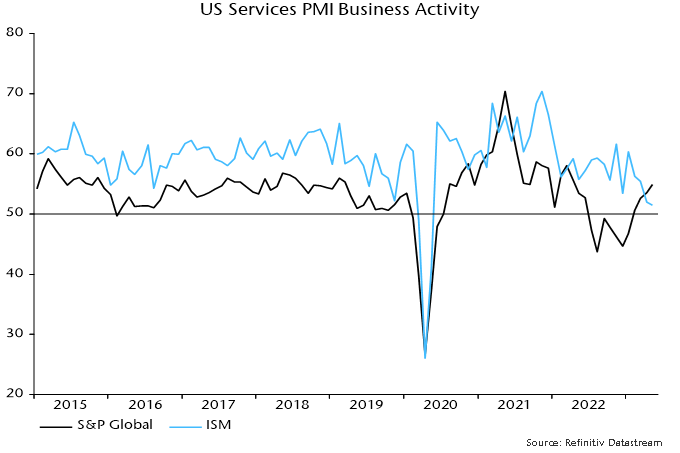
Thirdly, the high May readings of the global activity and new business indices reflect strong contributions from the US and Chinese components but national services surveys are significantly weaker.
The US ISM services activity index fell to a three-year low in May even as the S&P Global equivalent series reached a 13-month high – chart 4.
Chart 4
The Chinese NBS non-manufacturing new orders index moved below 50 in April and fell further in May, in puzzling contrast to the S&P Global / Caixin services new business index, which reached its second-highest level since November 2020.
The global manufacturing new orders and services new business indices have been strongly correlated historically but statistical tests indicate a tendency for manufacturing to lead services rather than vice versa*. With global monetary trends continuing to give a negative economic signal, the current unusually wide gap is more likely to be closed by services weakness than a manufacturing revival.
*In regressions using monthly data with three lags, lagged manufacturing new orders terms are significant in the regression for services new business, but lagged services new business terms are insignificant in the regression for manufacturing new orders.


![Jean-Philippe-Lemay, CC&L FG [504x504_03]](https://ns-partners.cclgroup.com/wp-content/uploads/sites/3/2025/06/FG_-Jean-Philippe-Lemay_504x504_03.jpg)