UK money trends signalling overheating risk
UK broad and narrow money measures continue to surge, with growth now significantly above that in the Eurozone – a reversal of the norm in recent years. This suggests strong near-term prospects for domestic demand and support for UK equity prices but at the likely cost of a sizeable deterioration in the balance of payments combined with much higher inflation.
Annual growth of the preferred broad money measure here – non-financial M4, comprising money holdings of households and private non-financial corporations – rose further to 15.6% in January, the highest since 1989. Eurozone money growth on a comparable measure – non-financial M3 – was 12.5%.
Chart 1

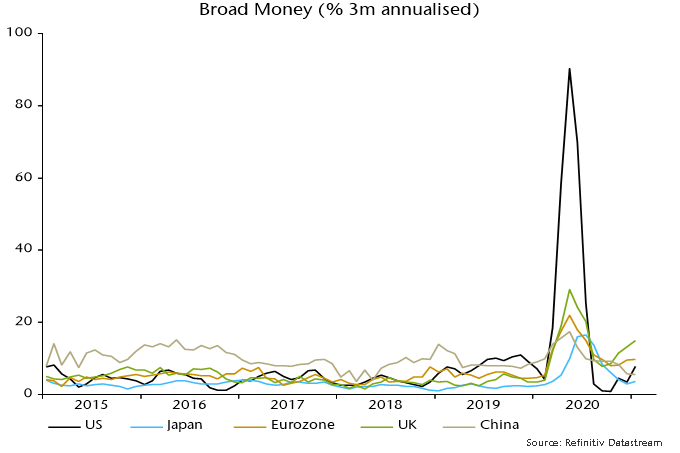
Annual broad money growth remains strongest in the US but the UK has moved into the lead on a three-month comparison: UK annualised expansion of 14.9% over November-January compares with 7.8% in the US and 9.8% in the Eurozone – chart 2.
Chart 2
The Bank of England has suggested that household bank deposits have been boosted by a recent outflow from National Savings but this provides, at best, only a partial explanation of broad money strength. A wider aggregate including National Savings and foreign currency deposits grew by 11.4% annualised in the latest three months.
The National Savings effect, in any case, may have been offset by an outflow from bank deposits to purchase unit trusts and OEICs: inflows to retail funds totalled £14.5 billion in November / December, according to the Investment Association, compared with a £9.1 billion outflow from National Savings over the same two months.
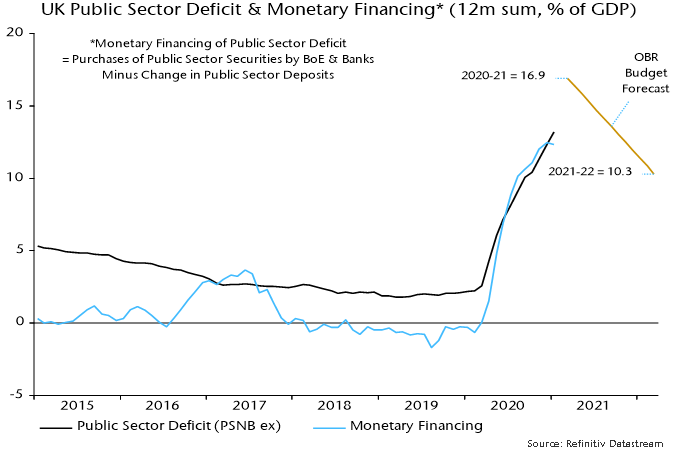
Why has UK broad money growth strengthened relative to trends elsewhere? The UK has been running a larger fiscal deficit and funding this almost wholly through the banking system. “Monetary financing” – net lending to government by the Bank of England and other monetary financial institutions – totalled £261 billion in the 12 months to January, equivalent to 93% of public sector net borrowing of £279 billion.
Monetary financing contributed (in an accounting sense) 13.7 percentage points (pp) to annual non-financial M4 growth of 15.6% in January; the equivalent contribution to non-financial M3 growth in the Eurozone was 7.4 pp.
Broad money trends set the medium-term path for nominal demand, incomes and inflation but narrow money is a better guide to short-term economic prospects. Six-month growth of real narrow money (non-financial M1 deflated by consumer prices) has risen since November and is stronger than in other major economies – chart 3.
Chart 3
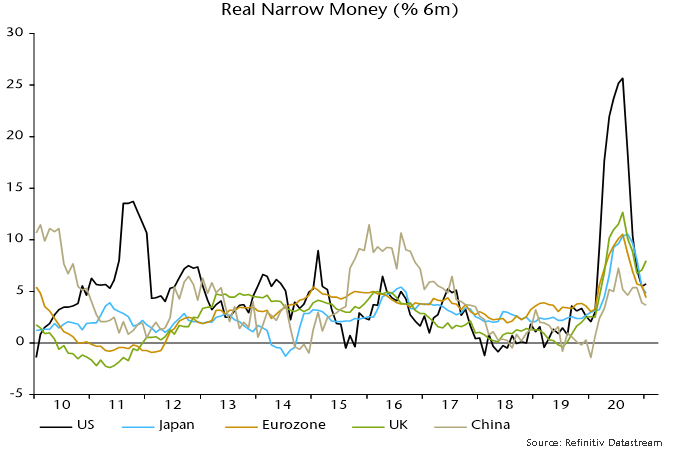
Six-month real narrow money growth was consistently lower than in the Eurozone over 2017-19, a period during which UK GDP lagged Eurozone growth by 1.4 pp (i.e. measured between Q4 2016 and Q4 2019). UK equities returned 5.1% less than Eurozone equities in the three years to end-2019, with underperformance accelerating last year, according to MSCI US dollar indices. With Eurozone six-month real narrow money growth continuing to moderate, the current UK lead is the largest since 2002.
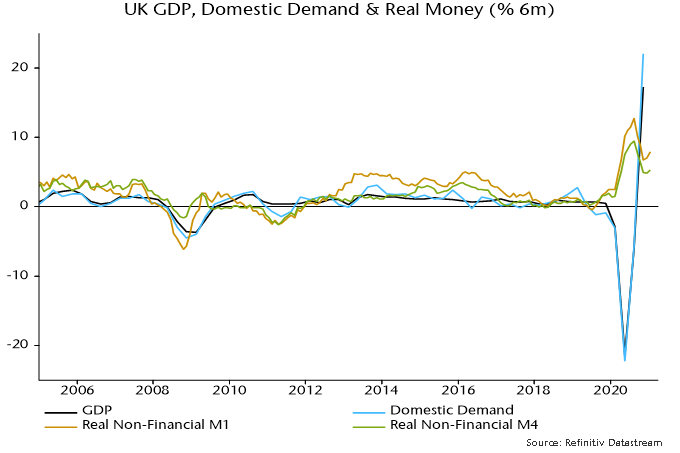
The rebound in six-month real money growth since November from an already strong level suggests a monetary boost to domestic demand and GDP momentum during H2 2021. This could interact with economic reopening to generate boom conditions by early 2022.
Chart 4
Domestic demand strength has been associated historically with rapid growth of imports and a worsening current account position. The impact could be magnified on this occasion by supply-side damage from the pandemic and a Brexit drag on exports. The CBI quarterly industrial trends survey asks manufacturers whether specified factors are acting to limit export orders. The Brexit effect is probably captured under “quota and import licence restrictions” and “political or economic conditions abroad”. The percentage citing the former is the highest since the 1980s, while the series for political / economic conditions abroad reached a record before the covid shock, rising further since. The percentage of firms expressing concern about price competitiveness, by contrast, is below the long-run historical average, though has increased as sterling has appreciated – chart 5.
Chart 5
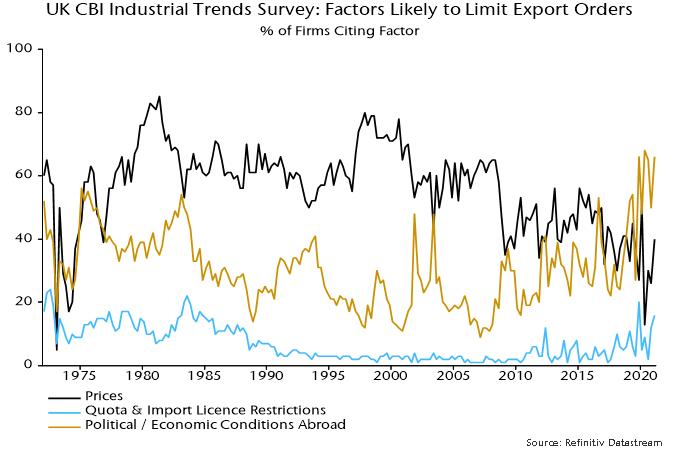
Services exporters are expected to be harder hit than manufacturers because of the omission of services from the trade agreement with the EU.
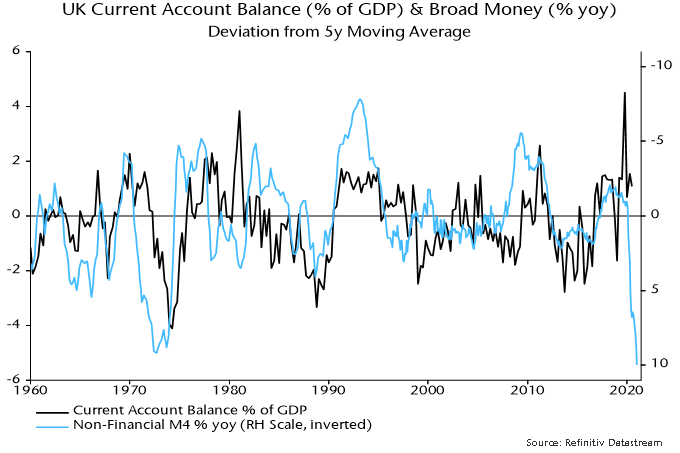
Chart 6 shows that the current account position has tended to deteriorate following a rise in broad money growth relative to the medium-term trend (plotted inverted), although often with a significant lag. A comparable money growth surge in 1971-72 was associated with the current account moving from surplus in 1972 to a deficit of 3.9% of GDP in H1 1974. The starting position now is worse, with a deficit of 2.9% of GDP in Q3 2020.
Chart 6
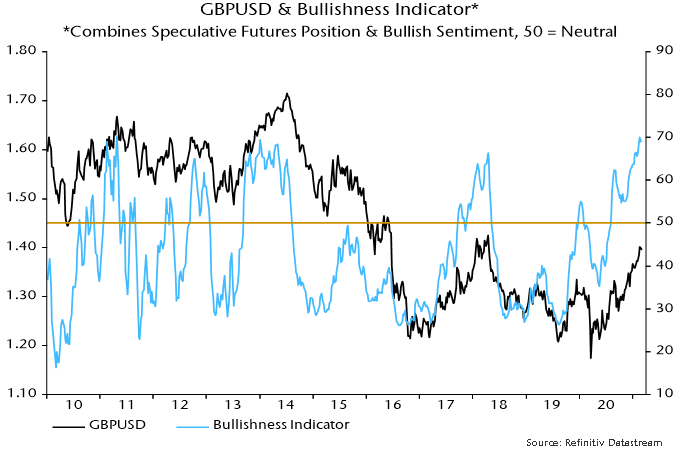
A blowout in the current account deficit would suggest medium-term downward pressure on sterling. A strong economic rebound might be expected to provide near-term support for the currency but speculators are already long and worries about the inflationary implications of fiscal dominance of monetary policy could bring forward weakness. An indicator combining speculative futures positioning and bullish sentiment as measured by Consensus Inc. is at the top of its range in recent years, suggesting a pause in sterling’s rally, at least – chart 7.
Chart 7
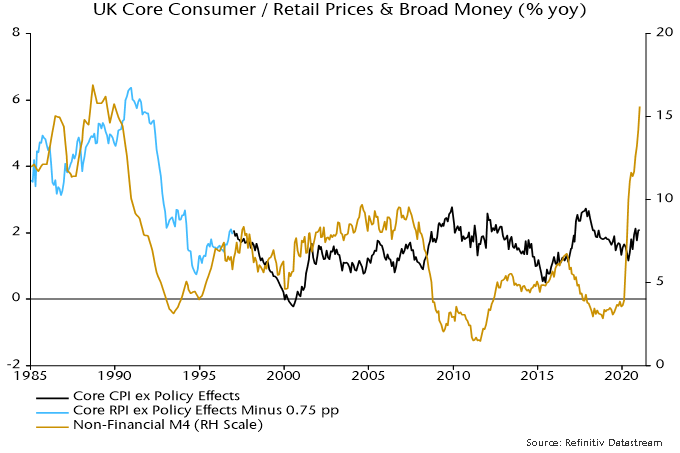
A fall in sterling has been a standard feature of the transmission of rapid UK money growth into inflation. As previously discussed, annual broad money growth has led turning points in annual core CPI / RPI inflation by an average of 26-27 months since WW2. With money growth still rising in January 2021, core inflation may pick up into early 2023, at least.
Chart 8
Annual broad money growth will moderate as bumper monthly rises over March-May 2020 drop out of the calculation but fiscal / monetary plans suggest that it will remain high. The MPC decided at its November meeting to buy an additional £150 billion of gilts during 2021, equivalent to 6.9% of the stock of non-financial M4 at the start of the year. Fiscal financing needs may call forth more QE, with the OBR now expecting borrowing of £234 billion in 2021-22, up from £164 billion in November and equivalent to 10.3% of GDP – chart 9.
Chart 9