Still no recovery in global real money growth
Investors appear to be in more optimistic mood about economic prospects, judging from recent relative strength of equities versus bonds and cyclical versus defensive sectors.
This revival of cyclical optimism is not supported by monetary trends. Global six-month real narrow money growth is estimated to have fallen slightly further in September, having reached a 22-month low in July and moved sideways in August – see chart 1. (The September estimate is based on monetary data covering 70% of the aggregate and near-complete inflation data.)
Chart 1
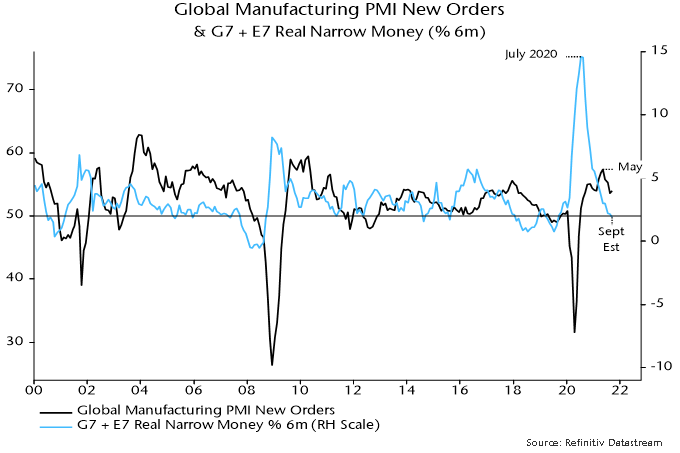
The fall in real money growth into July was the basis for a forecast here that global industrial demand momentum – proxied by the manufacturing PMI new orders index – would slow further into early 2022. The weak September reading, if confirmed, suggests that the slowdown will extend through end-Q1.
The rise in cyclical optimism is not attributable to policy news: the US spending bills remain stalled in Congress and more central banks are signalling hawkishly. PBoC officials last week played down the prospect of policy easing despite weak economic data.
The most likely explanation for the cyclical rally is growing evidence that supply chain blockages are easing. The global manufacturing PMI suppliers’ delivery times index bottomed in June / July, recovering marginally in August / September (lower readings = longer delivery times). October flash reports this week may show a further increase.
Industrial output momentum will rebound as sectors hobbled by supply constraints – autos in particular – normalise production. This pick-up, however, will be short-lived if demand growth continues to slow, as suggested by monetary trends.
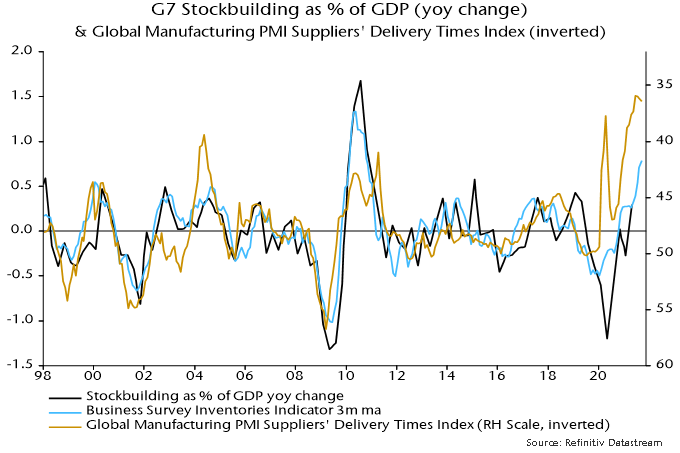
The easing of supply pressures, moreover, carries its own warning for demand prospects. The PMI delivery times index is inversely correlated with the rate of change of G7 stockbuilding – chart 2. Recent long delivery delays reflect not only pandemic-related disruption but also a scramble to boost inventories following intense destocking. The easing of blockages, therefore, is indirect evidence that the demand growth boost from the stockbuilding cycle is at or near a peak.
Chart 2
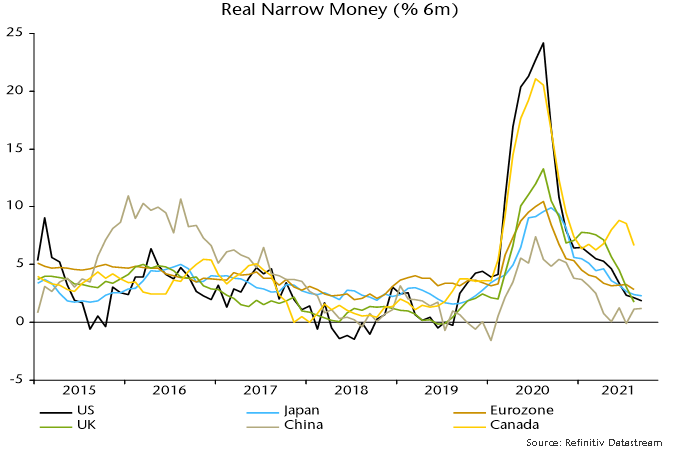
The global six-month real narrow money growth estimate for September incorporates further falls in the US / Japan and a stable Chinese reading – chart 3. The US / China gap – which surged last year, warning of divergent economic / equity market prospects – has almost closed. Eurozone and UK September monetary data will be released on 27 and 29 October respectively. Canadian numbers appear with a one-month lag: real money growth remained relatively strong in August (just released), suggesting that the Bank of Canada will be under pressure to hike rates soon.
Chart 3