UK GDP rebound trumped by deflator weakness
“Gangbusters” UK GDP growth of 0.6% in Q1 may partly reflect inadequate adjustments for the leap year and early timing of Easter. In any case, the bigger story in recent national accounts data is nominal deceleration.
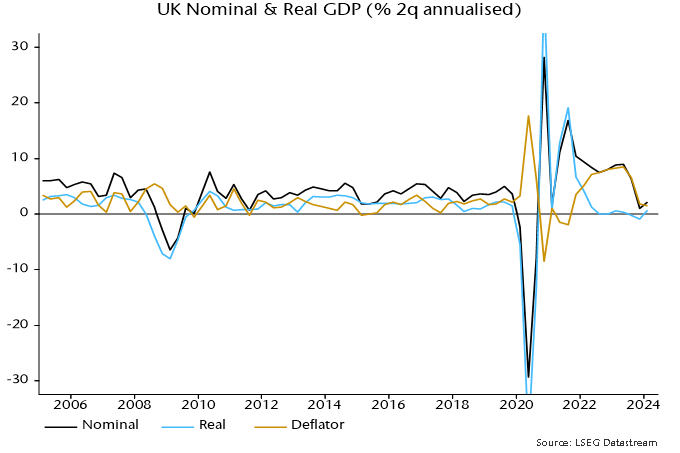
Nominal GDP rose at an annualised rate of 2.1% in Q4 and Q1 combined, down from 6.3% in the prior two quarters. With output momentum recovering slightly, the slowdown reflected a sharp fall in the rate of increase of the GDP deflator, from 6.6% annualised to 1.5% – see chart 1.
Chart 1
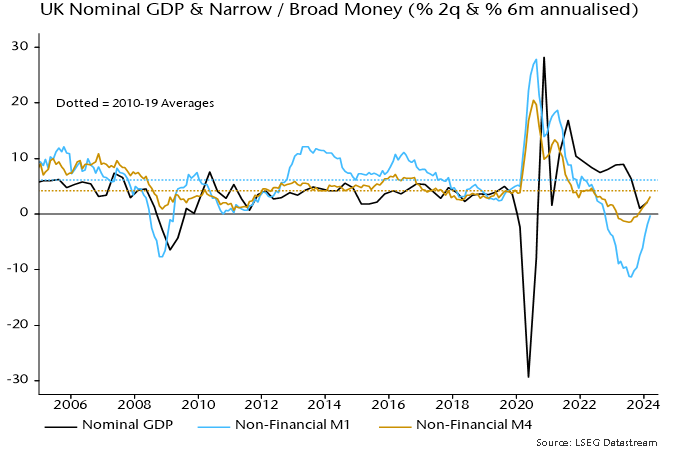
The drop in two-quarter nominal GDP momentum was signalled roughly a year ahead by falls in six-month broad and narrow money momentum into negative territory – chart 2. Money momentum has recovered since Q3 2023 but on both measures remains weaker than during the 2010s, when the GDP deflator rose at an average 1.8% pace.
Chart 2
As an aside, the latest Monetary Policy Report contains a lengthy discussion of monetary developments and their relevance for policy. The strategy, as usual, is to damn with faint praise. While “broad money growth and inflation appear to have moved together over long cycles … it is harder to take an unambiguous signal about inflationary pressures from growth in the aggregate money data in isolation over shorter, policy-relevant, horizons.”
Really? Study chart 2. A directional leading relationship in rates of change is obvious. Except around the initial Covid lockdown, there are no examples of money momentum giving a seriously misleading message about future nominal GDP developments. As well as signalling the 2021-22 inflation surge, money trends warned of economic weakness / falling price pressures in 2008-09 and 2011-12, while contradicting recession forecasts following the Brexit referendum result. “Monetarists” were on the right side of the policy debate on all these occasions.
The income analysis of GDP allows movements in the GDP deflator to be attributed to changes in labour costs and broadly defined profits per unit of output. How has the recent sharp slowdown been achieved given supposedly sticky wage pressures?
According to the national accounts numbers, employee compensation per unit of output rose at an annualised rate of 1.8% in Q4 / Q1, down from 6.9% in the prior two quarters – chart 3. This slowdown is consistent with official earnings data and reflects a combination of 1) a moderation in regular earnings momentum, 2) a fall in bonus payments and 3) a pick-up in productivity (i.e. output per worker) as employment fell.
Chart 3
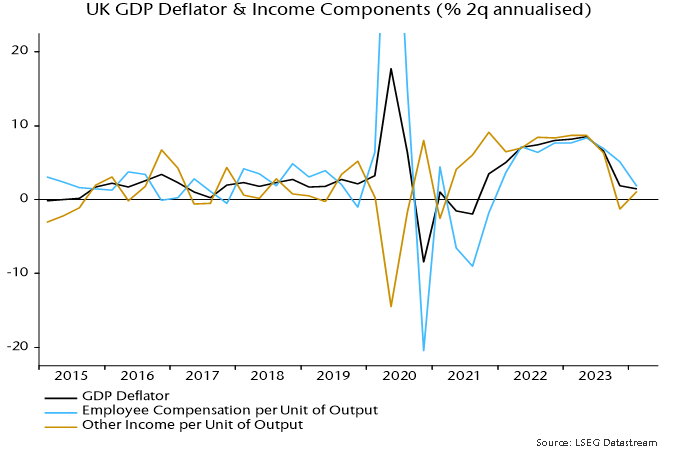
Profits and other “entrepreneurial” income per unit of output, meanwhile rose by only 1.1% annualised in the latest two quarters, versus 6.3% in Q2 / Q3 2023.
Domestic cost developments, therefore, are compatible with the inflation target while money growth, although recovering, remains too low. The “monetarist” view is that the MPC is behind the curve – again.