No QE boost to Japanese money growth
Japanese monetary trends continue to argue that current inflation is “transitory” and there is no case for BoJ policy tightening.
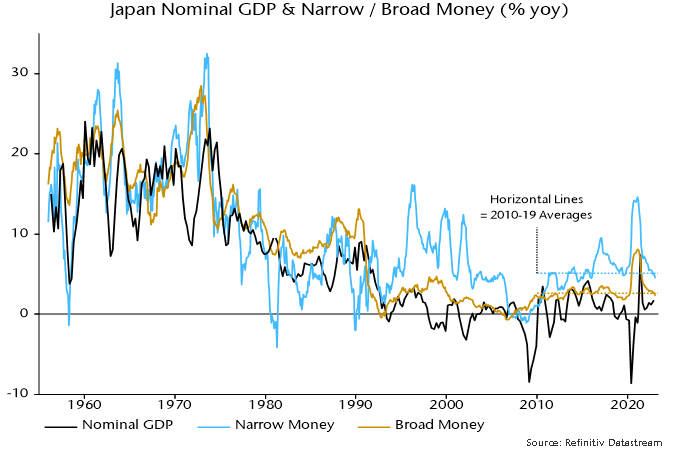
Broad money M3 rose by just 0.1% in January, pulling annual growth down to 2.3%, below a 2010-19 average of 2.6%. Annual M1 growth is also below its corresponding average – see chart 1.
Chart 1
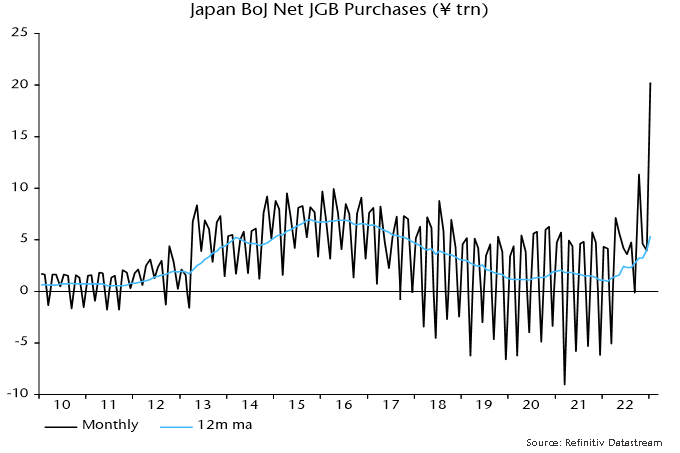
M3 showed little growth on the month despite BoJ net JGB purchases reaching a record ¥20.3 trillion, equivalent to $155 billion or 1.3% of the stock of M3 – chart 2. The modest M3 increase pushes back against claims that BoJ JGB buying has “pumped liquidity into markets”.
Chart 2
A counterparts analysis of M3 is not yet available for January but the lack of impact of QE is probably explained by the BoJ transacting mainly with commercial banks. A purchase from a bank involves a JGB / reserves swap with no effect on deposits held by non-banks.
A further technical point is that Japanese money definitions exclude holdings of non-bank financial institutions, so purchases from such institutions also have no direct effect on M3.
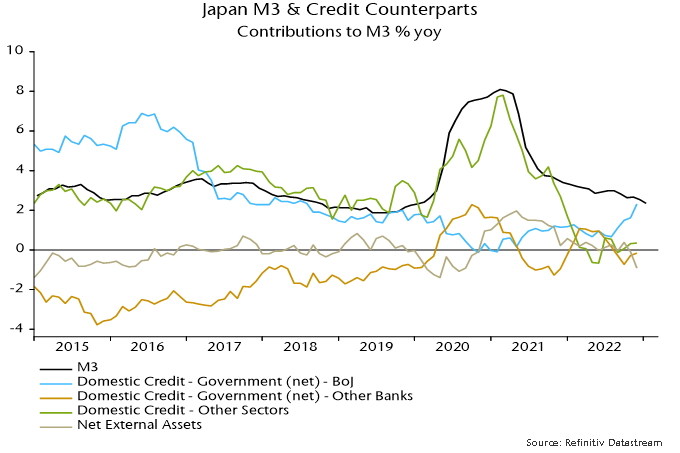
Chart 3 shows the contributions to annual M3 growth of selected credit counterparts through December. A substantial positive contribution from QE (domestic credit to government from BoJ) was offset by weakness in domestic credit to other sectors and negative contributions from commercial bank JGB sales (domestic credit to government from other banks) and net external flows. The latter drag partly reflects BoJ intervention to support the yen in late 2022.
Chart 3
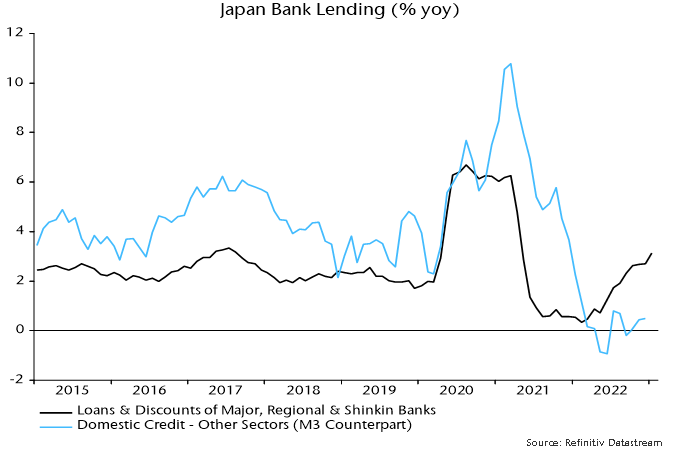
The weakness of credit expansion to non-government domestic sectors in the M3 counterparts analysis contrasts with a recent pick-up in annual growth of loans and discounts by major, regional and Shinkin banks – chart 4. The explanation for the divergence is that the M3 credit measure encompasses lending to non-bank financial institutions, including by the BoJ. Such lending surged during the pandemic but has contracted recently.
Chart 4
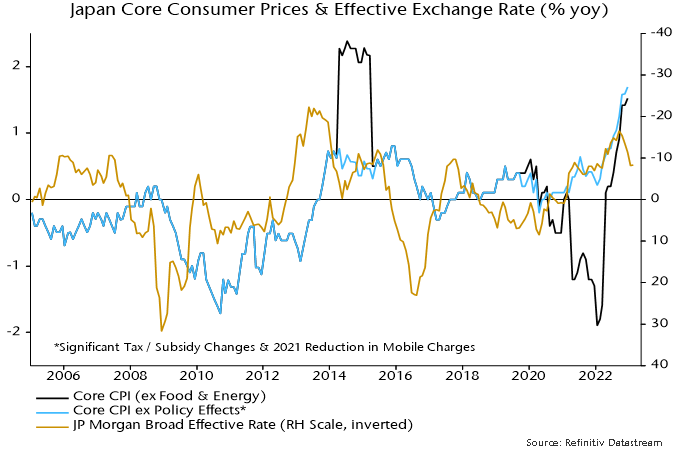
Annual all-items consumer price inflation rose to 4.0% in December, the highest since 1981, and may have reached 4.5% in January, based on Tokyo data. Core inflation adjusted for the impact of major policy changes was 1.7% in December and may have increased to 2.0-2.1% in January. The recent pick-up partly reflects yen weakness, which may be reversing – chart 5.
Chart 5
Annual cash earnings growth surged to 4.8% in December as winter bonuses reflected recent strong profits. Scheduled earnings growth of 1.8% is a better guide to trend but also represents a multi-decade high.
The reversal of the 2020-H1 2021 M3 growth surge suggests that inflation and earnings growth are at or near a peak and will return to pre-pandemic levels in 2024-25.