Monetary indicators still negative
Recent market weakness reflects an unfavourable monetary backdrop as well as negative geopolitical developments.
The monetarist view is that asset prices respond to imbalances between the supply of money and the demand to hold it. “Excess” money growth is associated with increased demand for financial assets and upward pressure on their prices, assuming no change in supply.
Excess money growth can’t be measured directly because the demand to hold money – based on current economic conditions and prices – is unobservable. Two proxy measures of global excess money are tracked here: the difference between six-month growth rates of real (i.e. CPI-deflated) narrow money and industrial output; and the deviation of 12-month real money growth from a slow moving average.
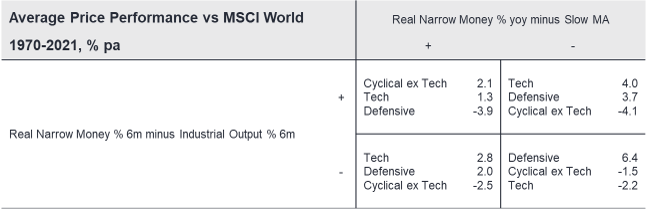
Historically, global equities outperformed cash significantly on average when both measures were positive but underperformed significantly when both were negative. Mixed signals were associated with a small return shortfall, i.e. no reward for assuming equity risk – see table 1.
Table 1

A post in early January noted that the second measure had turned negative in October while the first appeared to have followed in November, based on partial data. This “double negative” signal was confirmed later in January.
A January estimate of global real narrow money is now available, along with a firm data point for December industrial output. Both excess money measures remain negative.
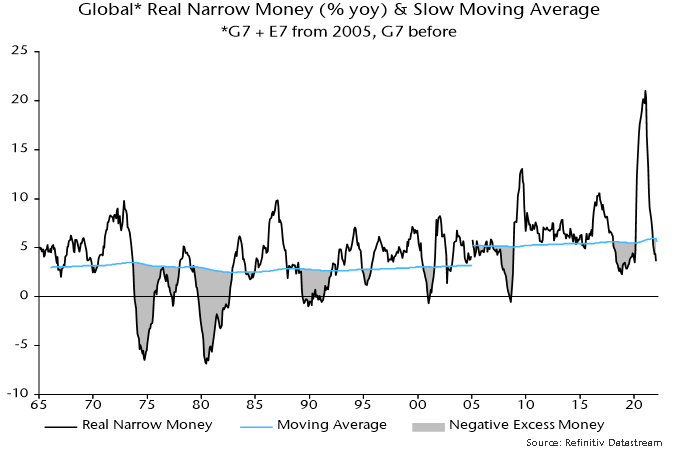
12-month growth of global real money is estimated to have fallen further below its moving average in January – chart 1. An early reconvergence seems unlikely – CPI inflation is probably peaking but a decline may be offset by a further slowdown in nominal money growth as large monthly increases a year ago drop out of the 12-month comparison.
Chart 1
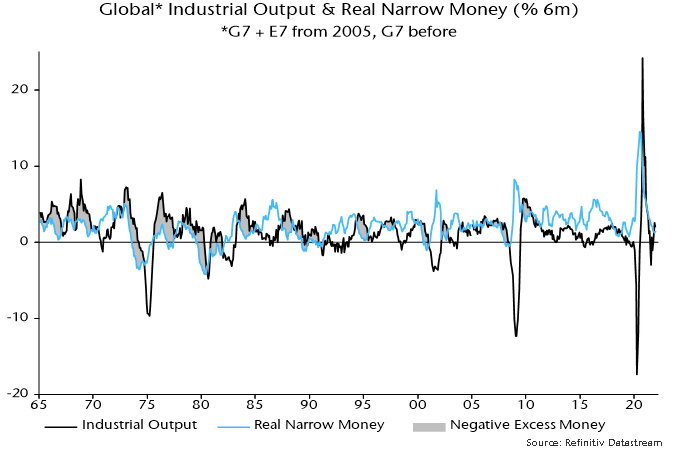
Meanwhile, six-month real narrow money growth was little changed in January and below December industrial output growth – chart 2. Six-month output growth may stay at or above the December level through March: a temporary production catch-up is in progress as supply constraints ease, US output rose solidly in January and base effects are favourable (output fell between June and September 2021).
Chart 2
The excess money measures have also been correlated with sector relative performance historically, with double negative signals associated with strong outperformance of the defensive sectors basket (which includes energy) and underperformance of cyclicals, including tech (IT and communication services) – table 2.
Table 2