Is the inventory cycle peaking?
Some forecasters expect global industrial momentum to receive a further boost over coming months from a rebuilding of manufacturing inventories. The assessment here, by contrast, is that the growth impact of the inventory cycle is peaking, although major weakness is unlikely until next year.
The stockbuilding or inventory cycle, also known as the Kitchin cycle, has an average length of 3.5 years – more precisely, 40 months – and is a key driver of overall economic activity and market behaviour. The history of the cycle is illustrated in chart 1, showing the contribution of stockbuilding to G7 annual GDP growth.
Chart 1
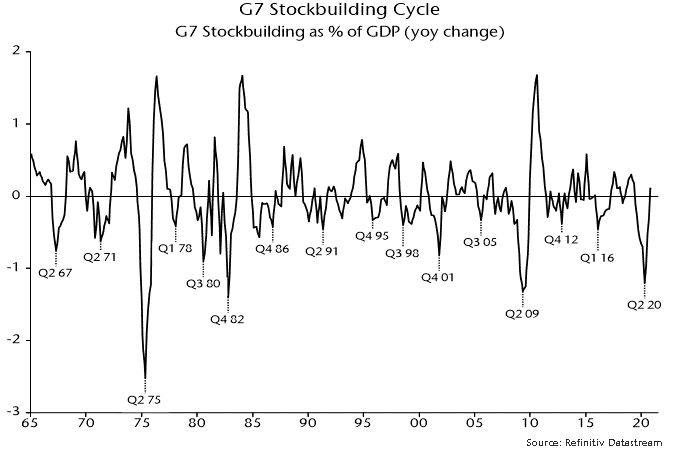
The cycle bottomed in April 2020, suggesting that the next low will occur around August 2023, based on the average 40-month length. This, in turn, would imply a cycle mid-point around December 2021 – seemingly supportive of the consensus view that that the growth impact of the cycle will remain positive in H2 2021.
There are three reasons, however, to doubt this interpretation.
First, the cycle usually peaks early after deep recessions. The maximum growth contribution topped out within five quarters after the 1975, 1982 and 2009 recessions, suggesting a current peak by Q3 2021.
Secondly, the current cycle could be shorter than average to compensate for a 50-month previous cycle, which was extended by covid shock, i.e. the current cycle could compress to 30 months, implying a mid-point around July 2021.
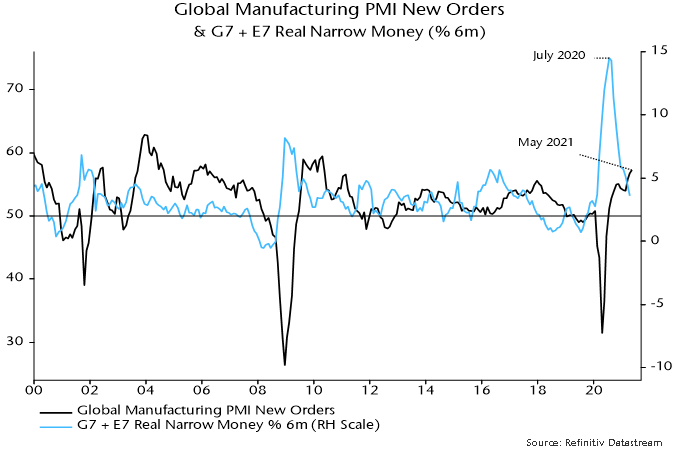
Thirdly, cycle peaks are signalled in advance by slowdowns in global real narrow money. Six-month growth of real money peaked in July 2020, with annual growth topping in January 2021.
The view that the cycle will deliver a further significant boost is based partly on the low level of the global manufacturing PMI finished goods inventories index. However, the stocks of purchases index, covering intermediate goods and raw material inputs, is near the top of its historical range – chart 2.
Chart 2

Growth of new orders and output is related to the rate of change of stockbuilding. This is illustrated in chart 3, showing a significant correlation between the PMI new orders index and the deviation of the stocks of purchases index from a moving average.
Chart 3
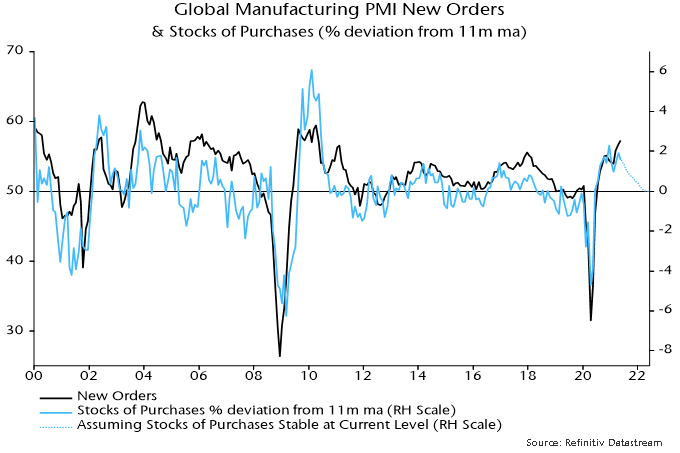
This rate of change measure has already peaked and will decline further even if the stocks of purchases index maintains its current high level, as shown by the dotted line on the chart. For this not to occur, the index would have to continue to rise by 0.25 points per month, implying a move through its record high during H2.
Will the drag on new orders from a stabilisation or decline in the rate of increase of intermediate goods / raw material stocks be offset by faster accumulation of finished goods inventories. The assessment here is that the net effect will be negative, based on two considerations.
First, there has been a stronger historical correlation between new orders and the rate of change measure for intermediate goods / raw material stocks than the corresponding measure for finished goods inventories.
Secondly, the maximum correlation is contemporaneous for the former measure but incorporates a three-month shift for the finished goods inventories measure, i.e. finished goods inventories lag new orders by three months. So a rise in this measure over June-August would be consistent with a May peak in new orders.
The view here remains that the PMI new orders index will weaken through late 2021, based on the fall in global six-month real narrow money growth between July and April – chart 4. An early estimate of real money growth in May will be available later this week, assuming release of Chinese numbers.
Chart 4