Is global reflation priced in?
Reflationary sentiment in markets is extreme, suggesting that investors should be cautious about chasing cyclical assets and inflation hedges.
The chart updates the reflationary sentiment indicator calculated here by combining bullish sentiment data sourced from Consensus Inc. for various markets that have correlated (positively or negatively) with global economic momentum historically. This week’s reading is a record in data extending back to 2000.
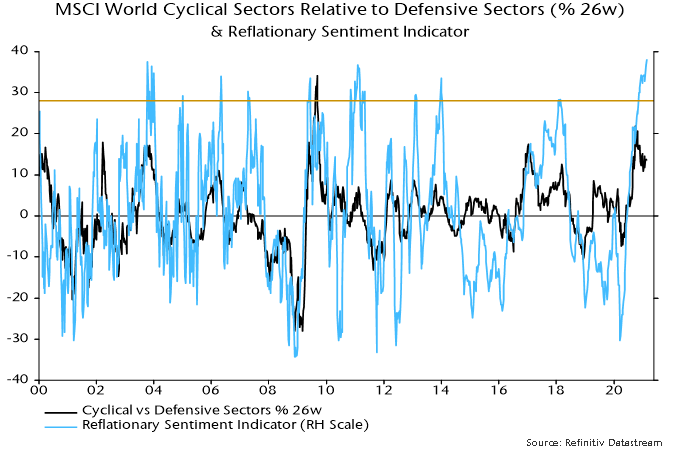
The sentiment indicator, unsurprisingly, correlates positively with the relative performance of MSCI World cyclical equity market sectors* but extreme readings often signal a short-term turning point.
Indicator values above the 95th percentile of the distribution over 2000-19 (the horizontal line) were associated with an average decline of 6.6% in the ratio of cyclical to defensive sectors within the following six months (i.e. from the starting level to the low point over that period). The range was -1.5% to -13.3%.
The maximum rise within the six months following an extreme positive indicator reading averaged 1.6%. In 8 of the 37 weekly cases, the sentiment extreme marked the high point of the cyclical to defensive sectors relative.
The time to switch to a pro-cyclical investment strategy was March last year when the sentiment indicator was at an opposite extreme and money measures were surging, suggesting strong support for economies and markets.
Global six-month real narrow money growth peaked in July 2020 and appears to have fallen further in January – an update will be provided following the release of remaining January country data over coming days.
*Cyclical sectors (MSCI definition) = materials, industrials, consumer discretionary, financials, real estate, IT and communication services. Defensive sectors = energy, consumer staples, health care and utilities.