Has the Eurozone really escaped recession?
A Eurozone recession can now be ruled out, according to the ECB and a PMI-hugging consensus.
Someone forgot to tell the monetary data.
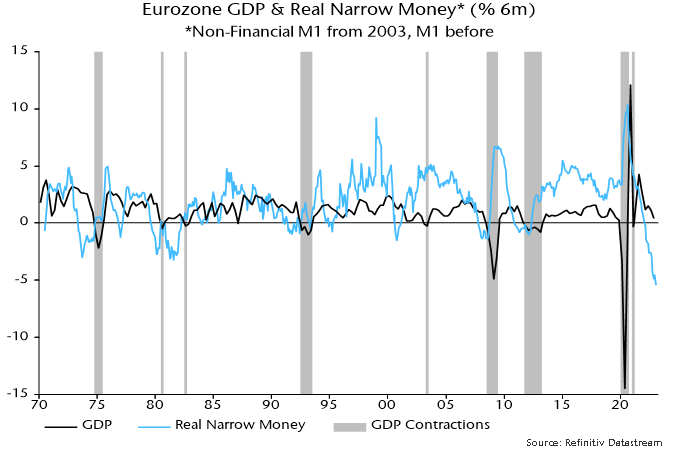
The favoured Eurozone narrow money measure here – non-financial M1 – fell for a fifth consecutive month in January, while broad money – non-financial M3 – was unchanged following marginal gains in November / December.
With inflation data remaining hot, six-month contraction of real narrow money (i.e. deflated by consumer prices) reached a new record, of 5.4% or 10.5% annualised – see chart 1.
Chart 1
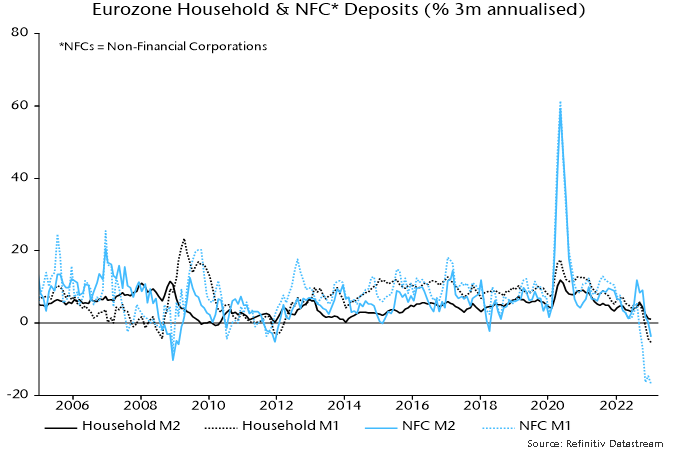
A post last month noted that UK sectoral money trends were displaying a recessionary pattern: corporate broad and narrow money holdings were falling in nominal terms, suggesting a cash flow squeeze, while households were moving large sums out of time deposits into sight deposits, consistent with a shift in consumer behaviour from spending to saving.
The same trends are now on show in the Eurozone: corporate M2 and M1 deposits fell in the three months to January, as did household M1 deposits – chart 2.
Chart 2
The no-recession bandwagon gained momentum following Eurostat’s flash estimate that Eurozone GDP grew by 0.1% in Q4. Recently released national details paint an uglier picture.
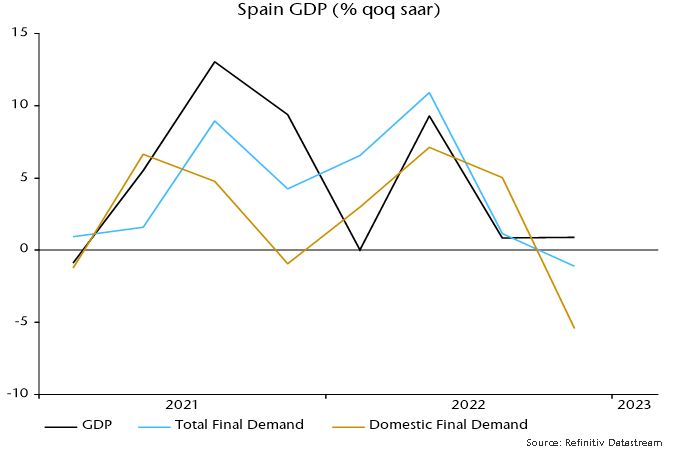
The Q4 fall in German GDP was revised from 0.2% to 0.4%, which will feed into an updated Eurozone number next week.
More significantly, expenditure breakdowns show that domestic final demand weakened sharply in Q4 in France, Germany and Spain – at annualised rates of 1.6%, 3.7% and 5.4% respectively. The GDP impact was cushioned by a rise in net exports driven by import weakness and a further increase in stockbuilding – charts 3-5.
Chart 3
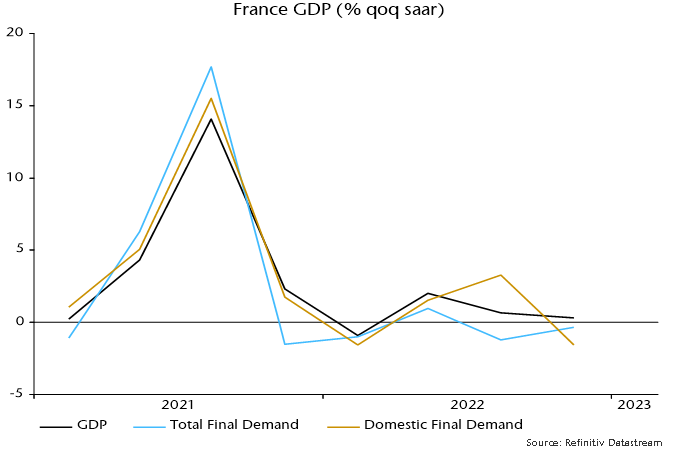
Chart 4
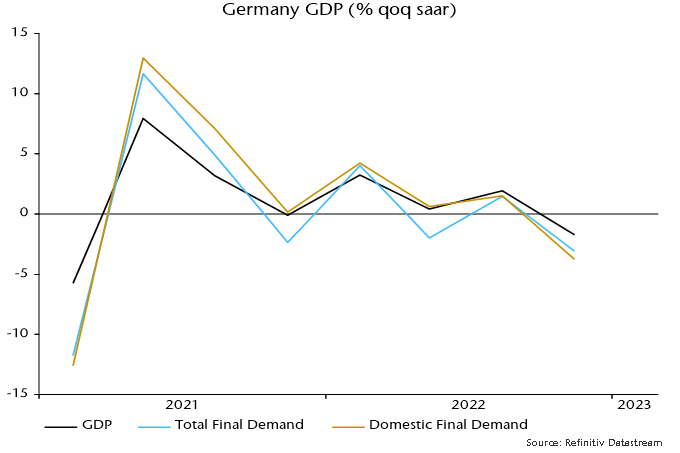
Chart 5
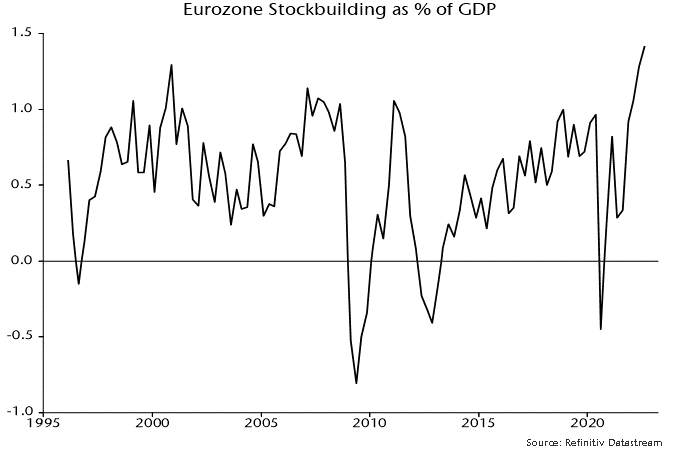
Eurozone stockbuilding, therefore, appears to have risen further from its record (in data since the mid 1990s) share of GDP in Q3 – chart 6. A violent reversal from lower peaks in 2007 and 2011 was a key driver of the 2008-09 and 2011-12 recessions.
Chart 6
The no-recession narrative was bolstered by February PMI results showing a pick-up in Eurozone services activity and new business. Manufacturing new orders, however, remained contractionary and are a better guide to the cyclical trend (since the key economic cycles – stockbuilding, business investment and housing – involve goods demand; there is no independent services cycle).
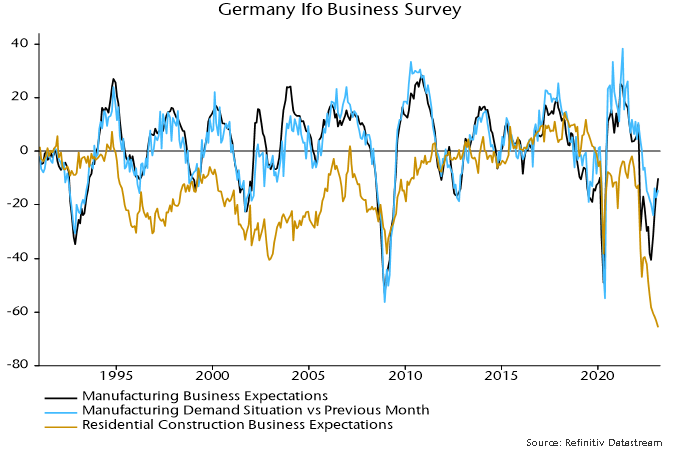
The move off the lows in manufacturing PMI results has been mirrored in the German Ifo manufacturing survey. Business expectations, however, remain weak by historical standards and an indicator of demand inflow has risen by less, stalling between December and February – chart 7.
Chart 7
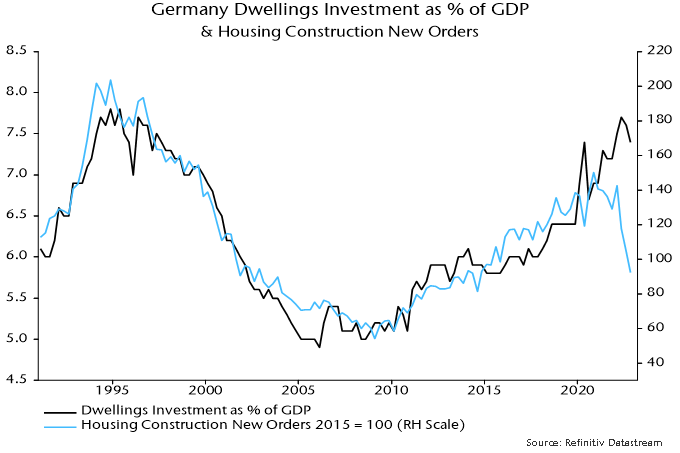
Residential construction expectations, meanwhile, plumbed another record low in February. Survey weakness has been reflected in hard data: housing construction new orders in Q4 were down 35% from Q1 and the lowest since 2014. Dwellings investment was a drag on GDP during H2 2022 but the orders plunge suggests a further big negative impact to come – chart 8.
Chart 8