Global slowdown on track, is real money growth bottoming?
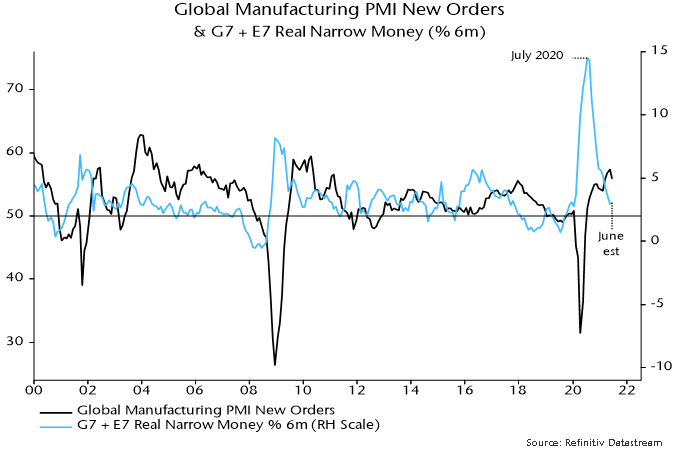
Global six-month real narrow money growth appears to have moved sideways in June and could be bottoming after a 10-month slide. If confirmed, and allowing for the usual lead time, this would suggest a stabilisation of industrial momentum in early 2022 following a H2 2021 slowdown.
The June real narrow money growth estimate is based on monetary data covering 70% of the G7 plus E7 aggregate tracked here and near-complete inflation numbers. The prior fall in real money growth is expected to be reflected in “surprising” weakness in global PMI manufacturing new orders and other coincident indicators of industrial momentum during H2 2021 – see chart 1.
Chart 1
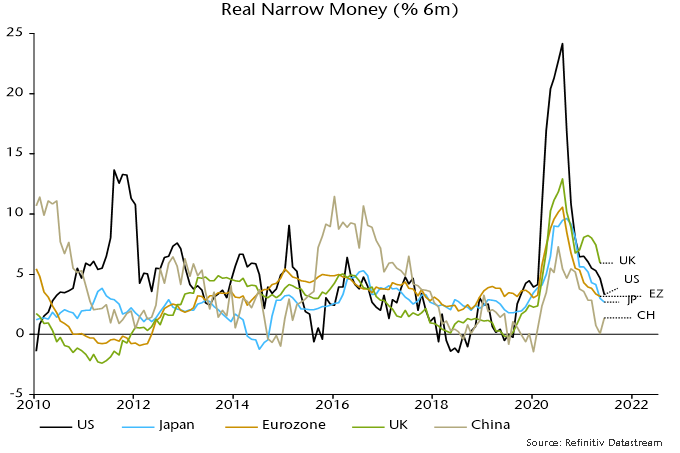
Global stabilisation conceals a June recovery in Chinese six-month real narrow money growth offset by further slowdowns in the US and Japan, with European data yet to be released – chart 2.
Chart 2
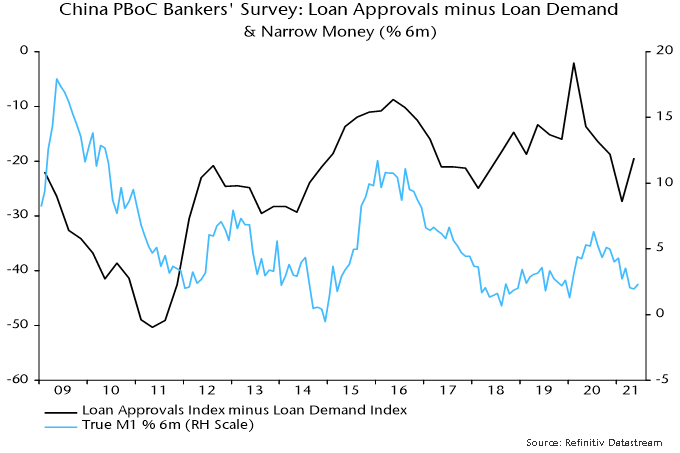
The recent cut in reserve requirements is judged here to confirm a trend shift in Chinese monetary policy, probably heralding a sustained rebound in money growth. Another indication of a policy turn is a rise in the differential between the loan approvals and loan demand indices in the PBoC Q2 bankers’ survey, suggesting that banks have been instructed to loosen credit – chart 3.
Chart 3
Street claims that last week’s Chinese activity data were solid, implying no need to adjust policy settings, are puzzling. GDP grew by only 3.4% annualised between Q4 and Q2. Monthly indicators are stagnant in real seasonally adjusted level terms – chart 4.
Chart 4
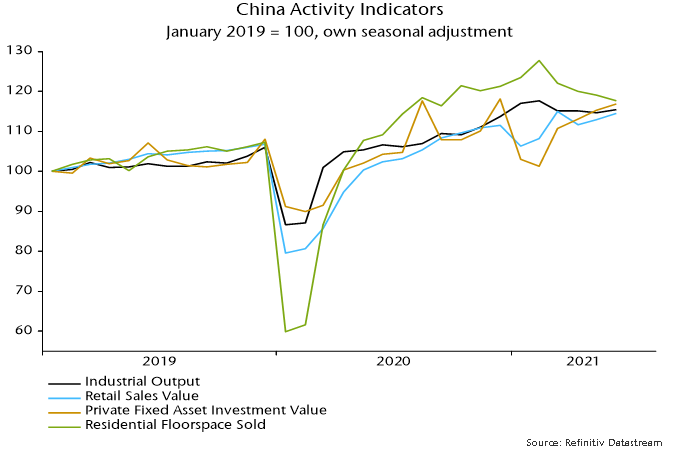
The view here is that the economy faced a “hard landing” without a policy change but the authorities have recognised the risk and will act to avert it.
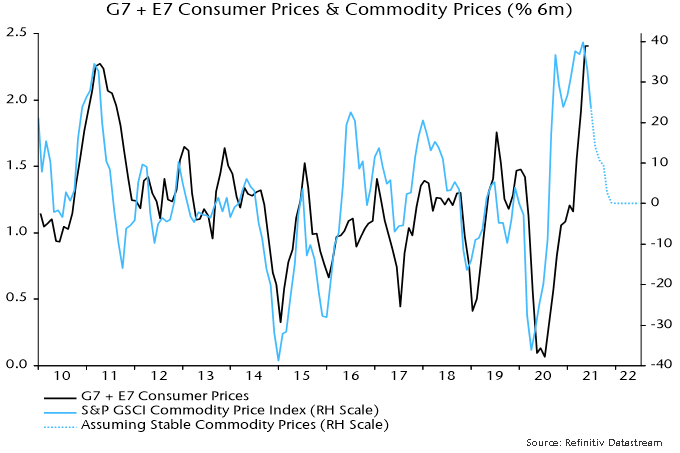
Support to global real money growth from Chinese easing should be supplemented by a slowdown in global six-month CPI inflation in H2, assuming stable commodity prices – chart 5. Commodity prices could weaken as industrial activity decelerates.
Chart 5
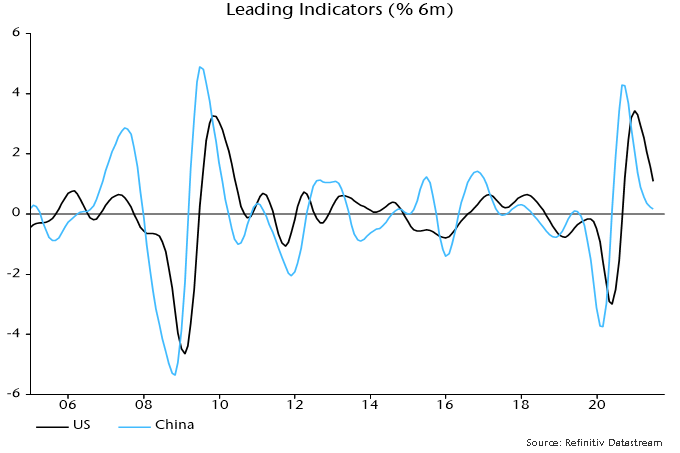
China continues to lead US / global economic momentum. The six-month rate of change of the OECD’s US leading indicator peaked four months after that of a Chinese indicator – chart 6*. This fits with a four-month interval between peaks in 10-year government bond yields – November in China, March in the US.
Chart 6
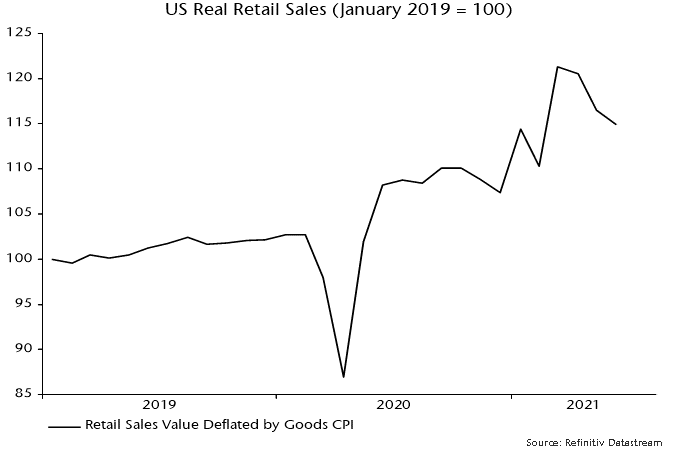
Street descriptions of US June retail sales as “robust” are also questionable. With prices surging, sales fell for a third month in real terms, consisent with a fading boost from March / April stimulus payments – chart 7.
Chart 7
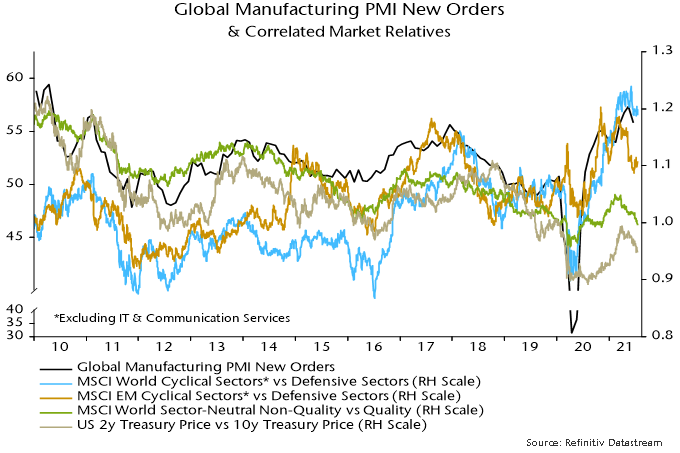
Markets have already partially discounted a H2 economic slowdown, with quality stocks outperforming and bullish flattening of yield curves. Non-tech cyclical sectors of developed equity markets have so far held up against defensive sectors and could be the next shoe to drop – chart 8.
Chart 8
*The indicators shown use the OECD’s methodology but are calculated independently.