Global money trends signalling policy overkill
Central bankers have ignored the lessons of their 2020-21 policy blunder and deserve the opprobrium they are likely to attract as an economic debacle continues to play out over coming quarters.
Policy-making can be accurately described as anti-monetarist, not merely in the sense that money data are ignored but rather that decisions are the precise opposite of those warranted by monetary trends.
The central banks continued to pursue ludicrously outsized QE in 2020-21 even as money growth surged to a level that would have embarrassed their 1970s predecessors; and they ripped up earlier guidance and tightened aggressively this year despite monetary trends screaming recession and now deflation risk.
June money data for the US, Eurozone and UK published this week highlight the scale of the policy fiasco under way before this month’s further tightening moves. (The Bank of Japan deserves an honourable mention for refusing to join the lemming rush.)
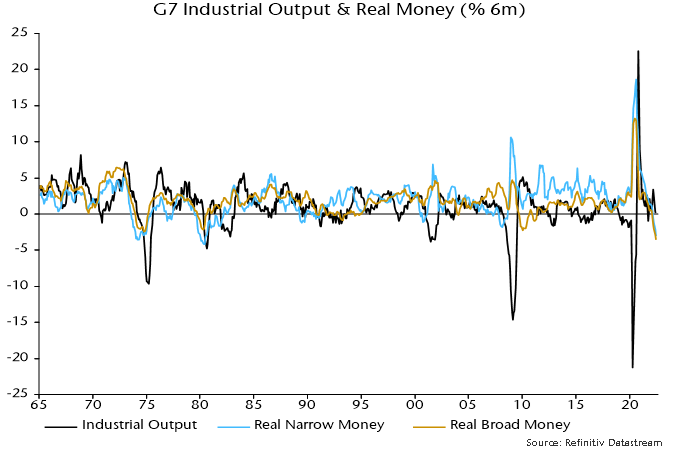
With Canada yet to release June data, the six-month rate of change of G7 real narrow money is estimated to have fallen further to -3.1% (-6.1% annualised), a level previously reached only before / during severe recessions in the mid 1970s and early 1980s. Real broad money, meanwhile, is contracting faster than during those episodes – see chart 1.
Chart 1
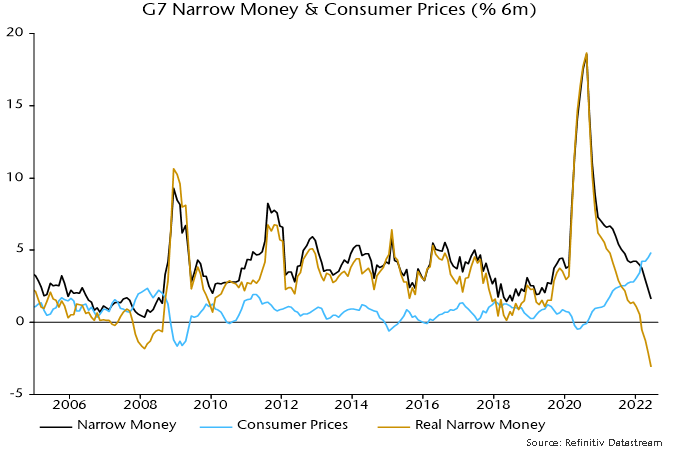
Until April, real money weakness was attributable mainly to high inflation – six-month growth of nominal narrow money, though slowing sharply, was still in the middle of its pre-pandemic range. No longer: six-month nominal growth fell to 1.6% (3.3% annualised) in June – chart 2.
Chart 2
The impact of this year’s policy tightening is better reflected in the three-month rate of change, which crossed below zero in June, a rare occurrence signalling recession and / or price declines historically – chart 3.
Chart 3
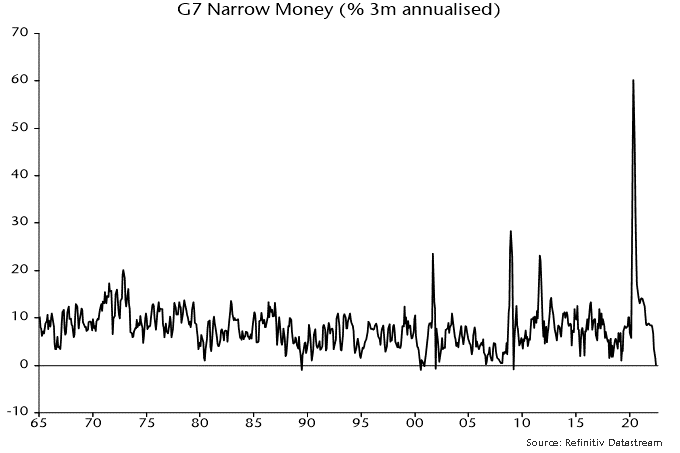
The narrow money measures calculated here for the US and UK fell month-on-month in June, while the Eurozone measure was flat.
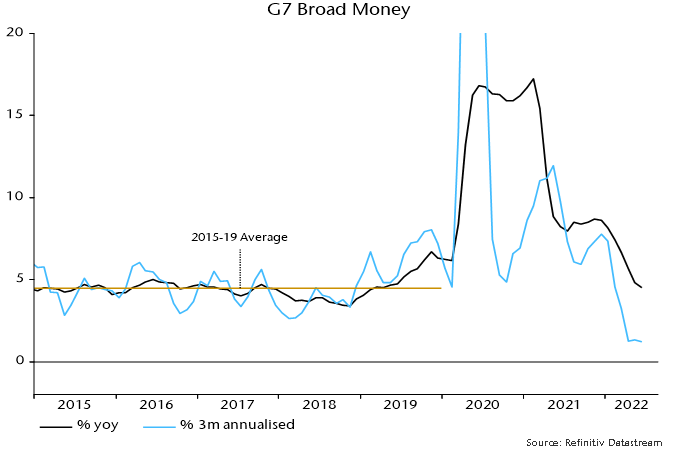
Narrow money is more sensitive to policy changes than broad money but the broad numbers are no less alarming. Three-month growth of G7 broad money slumped to 1.3% annualised in April, moving sideways in May and June – chart 4.
Chart 4
The monetary evidence, therefore, is that policy settings had already reached overkill territory by mid-year, suggesting a severe recession with rising medium-term deflation risk.
One false counter-argument to this assessment cites the strength of bank loan growth, particularly in the US. Non-monetarists offer this as evidence that financial conditions are not yet restrictive. Even some monetarists have suggested that lending strength is relevant for assessing rate settings, since money growth will recover if lending momentum is sustained.
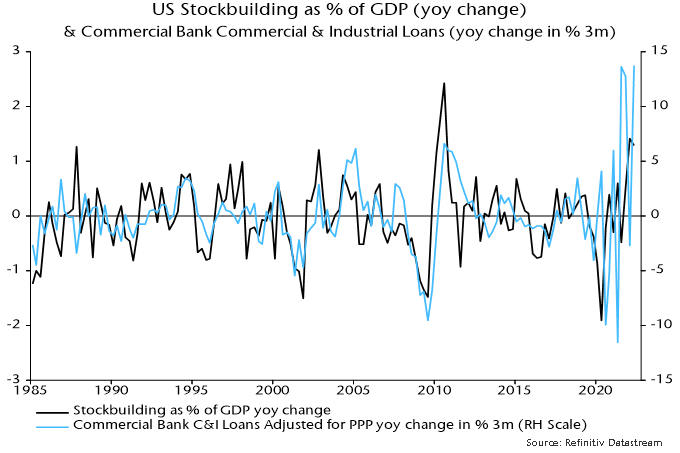
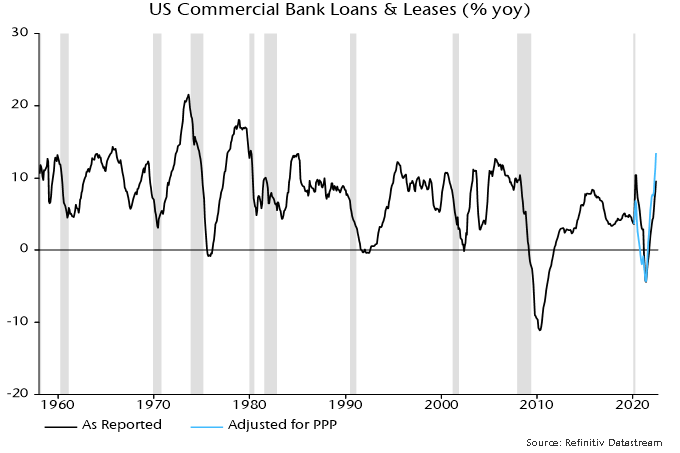
It won’t be. Bank lending is a coincident / lagging indicator of the economy. It is normal for loan growth to be strong and / or rising before a recession – chart 5.
Chart 5
Corporate loan demand has been inflated by an unusually large surge in stockbuilding that is now starting to reverse – chart 6. The ECB’s latest bank lending survey signalled a sharp fall in credit demand, along with tightening supply – expect the corresponding Fed survey next week to give the same warning.
Chart 6