Global monetary update: no respite
Global six-month real narrow money momentum, the key economic leading indicator in the forecasting approach employed here, is estimated to have moved sideways in deep negative territory in August* – see chart 1. Allowing for an average nine-month lead, the suggestion is that an incipient global recession will extend through Q2 2023, at least.
Chart 1
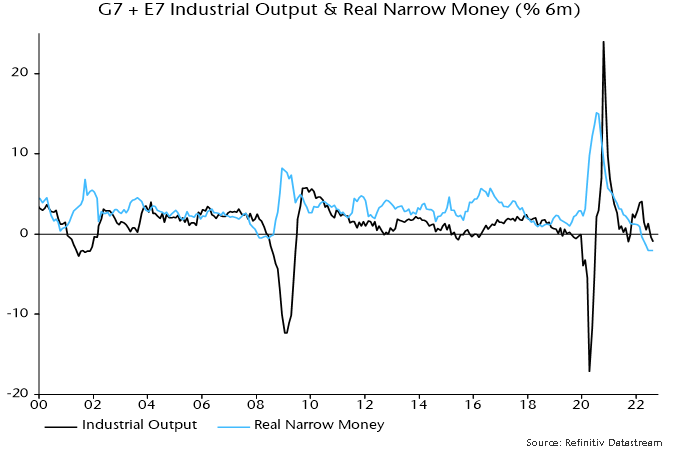
More specifically, global six-month industrial output momentum, which crossed below zero in July and is estimated to have weakened further in August, may continue to fall into April / May next year, with no monetary signal yet of a subsequent slowdown in the pace of contraction.
The lack of recovery in real narrow momentum is disappointing since, as previously discussed, global six-month consumer price momentum pulled back in July / August. This slowdown, however, was offset by a further fall in nominal money expansion – chart 2.
Chart 2
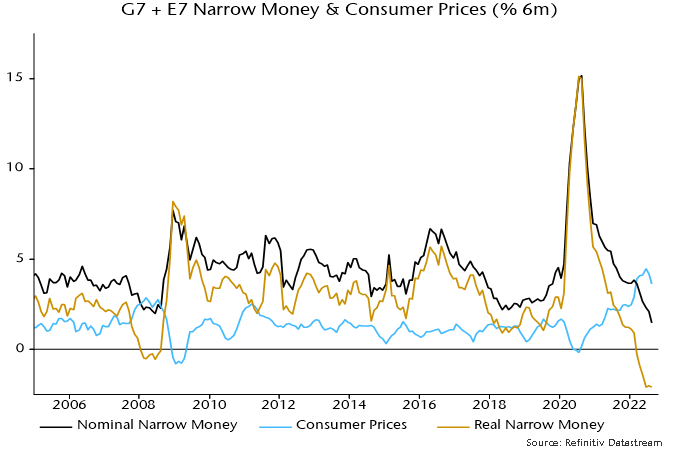
Nominal money weakness, encompassing broad as well as narrow aggregates, is evidence that monetary policies were already over-restrictive before the latest round of hair-shirt rate hikes.
What does this monetary backdrop imply for markets? The two measures of global “excess” money calculated here, i.e. the differential between six-month real narrow money and industrial output momentum and the deviation of 12-month real money momentum from a long-term moving average, remained negative in August – chart 3.
Chart 3
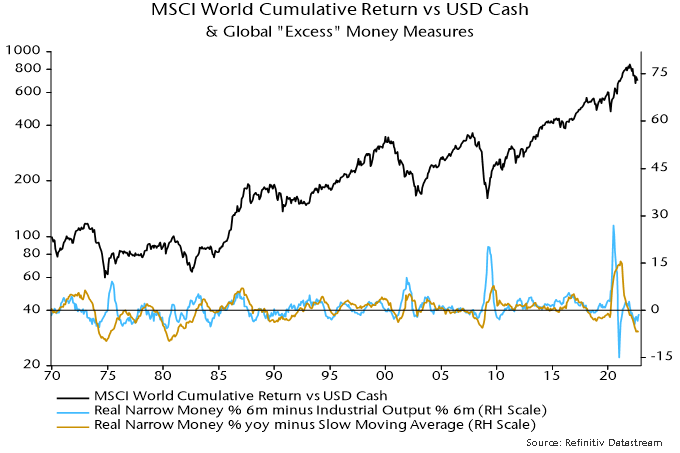
Historically (i.e. over 1970-2021), global equities outperformed cash on average only when both measures were positive, with underperformance greatest when both were negative.
Previous posts suggested that the first measure would turn positive during H2. This remains possible despite the disappointing August monetary data: the measure has recovered since June as industrial momentum has fallen and output may soon be contracting at a faster pace than real money.
The second measure, however, is likely to remain negative until well into 2023: 12-month real money momentum weakened further in August and the long-term nature of the moving average implies that it will make little contribution to closing the current wide gap.
The projected development of the measures, i.e. the first crossing back above zero but the second remaining negative, would suggest a slowdown but not reversal in the bear market in late 2023.
The message for government bond markets is more hopeful. Changes in bond yields have been inversely correlated with changes in the first excess money measure historically, i.e. bonds have, on average, rallied when the measure has risen, even while it has remained negative – chart 4**.
Chart 4
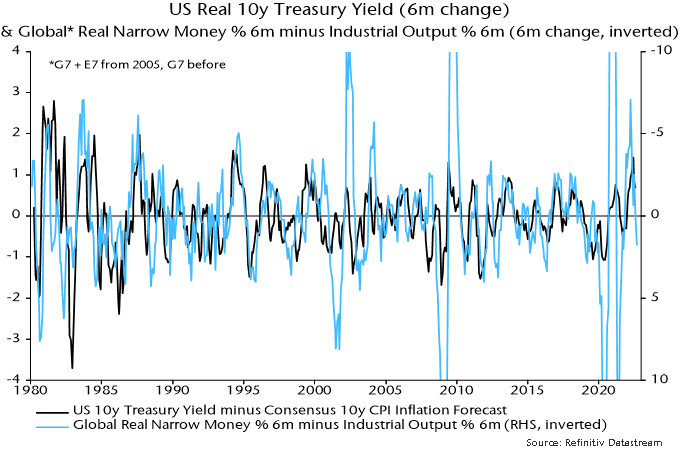
The six-month change in the excess money measure turned positive in August, having been negative – implying an unfavourable monetary backdrop for bonds – between November 2021 and July. US 10-year Treasuries have outperformed cash by 4.2% pa on average historically following positive readings.
*The estimate incorporates monetary data covering two-third of the aggregate and complete CPI results.
**The change in the measure is plotted inverted in the chart.