Global manufacturing PMI peak delayed, relapse still likely
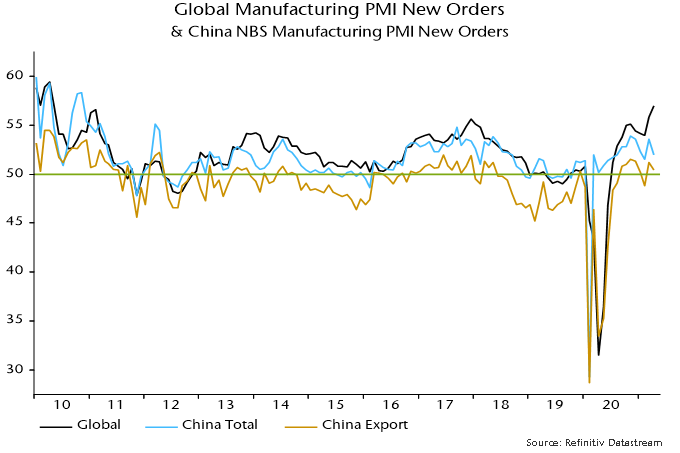
The forecast here at the start of the year was that the global manufacturing PMI new orders index – a key indicator of industrial momentum – would reach a peak in early 2021 and fall into the summer. The index declined slightly between November and February but rose to a new recovery high in March, with flash data last week and today’s Chinese results indicating a further significant increase in April. What has gone wrong?
The expectation of an early 2021 peak and subsequent relapse was based on a fall in global six-month real narrow money growth from an extreme peak in July 2020 – real money growth has led turning points in PMI new orders by 6-7 months on average historically. Six-month real narrow money momentum continued to weaken into March, so the monetary signal for PMI direction remains negative – see first chart.
Chart 1
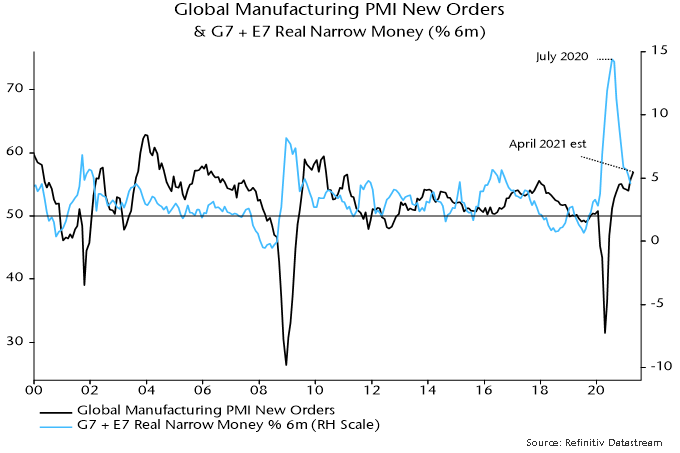
There was meaningful variation around the 6-7 month historical average lead time. An April PMI new orders peak, were it to be confirmed, would imply a nine-month lead, which would be within one standard deviation of the average. So the further rise into April is not yet an unusual departure from the norm.
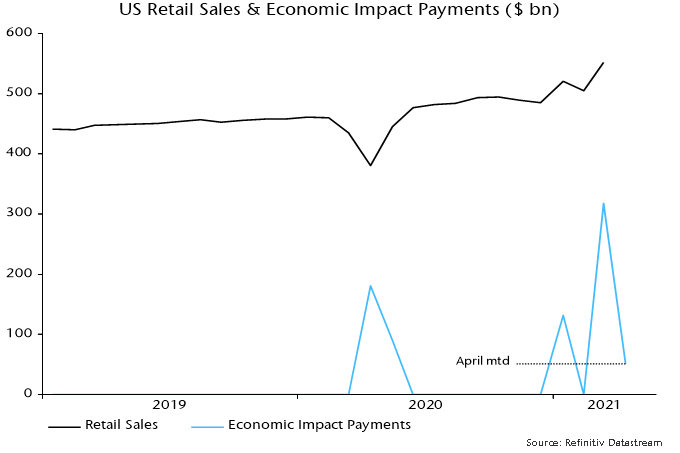
The most likely explanation is that the PMI upswing has been extended by US fiscal stimulus – particularly the third round of payments to households – along with initial moves towards economic reopening in the US, UK and other countries showing progress in virus containment. A 9.3% monthly surge in US retail sales in March may have been a key driver of stronger March / April new orders.
“Economic impact payments” authorised by the American Rescue Plan Act were $318 bn in March and $51 bn through 28 April for a total $369 bn, representing the bulk of a programme costed at $411 bn by the Congressional Budget Office.
New York Fed analysis of data collected in its monthly survey of consumer expectations indicates that households have spent or plan to spend 25% of the windfall, similar to the proportion in the first and second rounds, with remainder used to increase savings (42%) or pay down debt (34%). Rounding the $369 bn received to date up to $400 bn, this suggests additional consumer outlays of about $100 bn.
Assume that half of this amount is spent on goods, which could be an overestimate given that services account for two-thirds of total consumption. That would suggest additional retail sales – a rough proxy for goods spending – of about $50 bn. Monthly sales jumped by $47 bn between February and March. The suggestion is that the bulk of the boost to goods spending has already occurred and sales will fall back sharply into the summer.
Chart 2
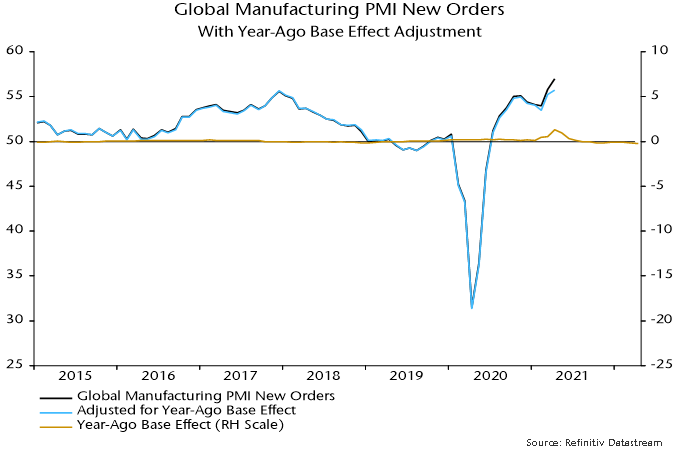
An additional technical explanation for the March / April rise in PMI new orders is a positive base effect from the slump in the index to a low in April 2020. Survey respondents are asked to draw a comparison with the previous month but there is evidence that some replies take into account the level of business in the same month a year earlier – understandable in cases where there is a strong seasonal pattern in demand.
Specifically, a regression of the global manufacturing PMI new orders index on its one- and 12-month lagged values finds a small but statistically significant negative coefficient on the latter*. The coefficient suggests that a 13.7 point plunge in the index in March / April 2020 contributed 0.8 of a point to the estimated 3.0 point increase in March / April 2021 – third chart. This boost will reverse by June, reflecting the recovery in the index after April last year.
Chart 3
With global real narrow money growth still moderating, the US fiscal boost probably passing its maximum and China still on a slow growth path pending PBoC easing, the forecast here of a PMI pullback through late Q3 is maintained.
Chart 4
*The same result is obtained using US ISM manufacturing new orders data over a much longer sample.