G7 inflation peaking on schedule
The “monetarist” rule of thumb that monetary changes feed through to prices with a lag of about two years suggests that G7 consumer price inflation will fall steeply from early 2023.
G7 headline annual CPI inflation, as calculated here*, moved back up to 7.6% in September, just below a June high of 7.7%.
A QE-driven surge in G7 annual broad money growth in 2020-21 was similar in magnitude to a bank lending-driven surge in the early 1970s. A peak in money growth in November 1972 was followed by an inflation peak exactly two years later – see chart 1.
Chart 1
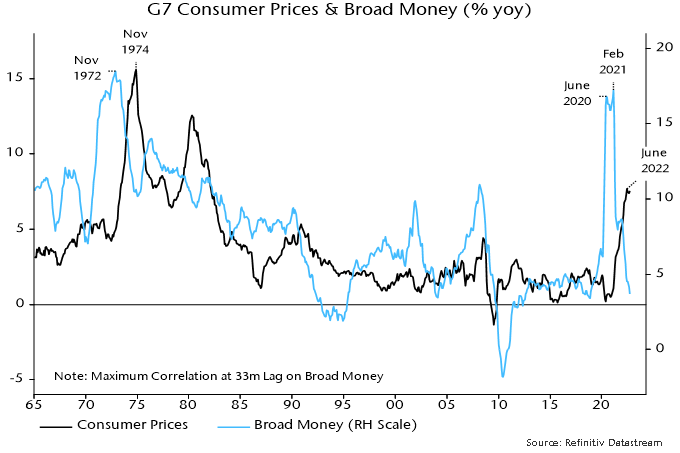
The 2020-21 money growth surge was largely complete by June 2020, although the final peak occurred in February 2021. The expectation here is that the June 2022 peak in CPI inflation will hold but the two-year norm suggests that a big fall will be delayed until after February 2023.
Annual broad money growth collapsed from February 2021, falling much faster and further than after the 1972 peak. Then, money growth bottomed above 10% in 1975 and rebounded into 1976, remaining in double digits until 1980. Sustained strength allowed high inflation to become entrenched.
Annual broad money growth is now below 4% (September estimate), with QT plans and a likely credit crunch suggesting further weakness.
Money growth was relatively stable between 2013 and 2018, averaging 4.3% pa. CPI inflation averaged just 1.2% over 2015-20 (i.e. allowing for a two-year lag). Current monetary weakness suggests similar or lower inflation outturns in 2024.
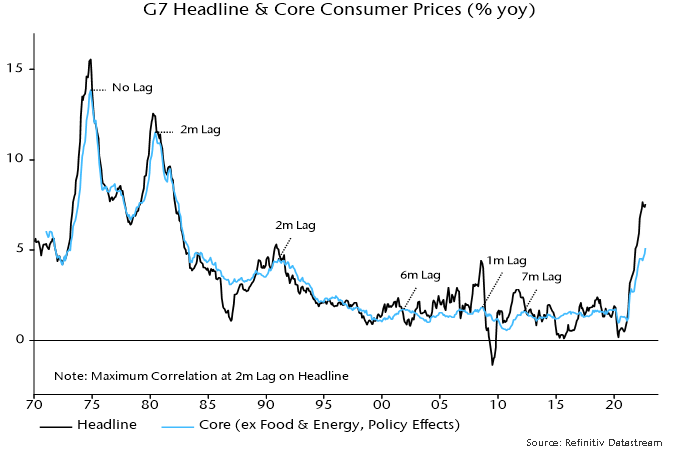
While headline probably peaked in June, core inflation continued to rise into September – chart 2. Core strength is feeding pessimism about inflation prospects, but shouldn’t. Contrary to popular mythology, core usually lags headline at turning points. Base effects boosted the G7 core annual rate over July-September but turn more favourable from October through next May (seasonally adjusted, the core index rose by an average 0.44% per month over October 2021-May 2022 versus 0.19% over July-September 2021).
Chart 2
*GDP-weighted, Japanese September CPI estimated from Tokyo data.