Echoes of 2008 in UK monetary / labour market data
The consensus is gloomy about UK economic prospects but is it gloomy enough?
The current debate has echoes of mid-2008. Q2 2008 was the first quarter of the most severe post-war recession. The consensus that summer was that the economy would eke out growth with a limited rise in unemployment and no need for significant policy easing.
A recession is widely acknowledged / expected now but the majority view is that it will be shallow and short-lived, partly reflecting recent energy price relief. Labour market damage is projected to be modest and there is general approval of recent MPC policy tightening.
Monetary trends warned of worse-than-expected outcomes in 2008 and are giving an equally negative message now.
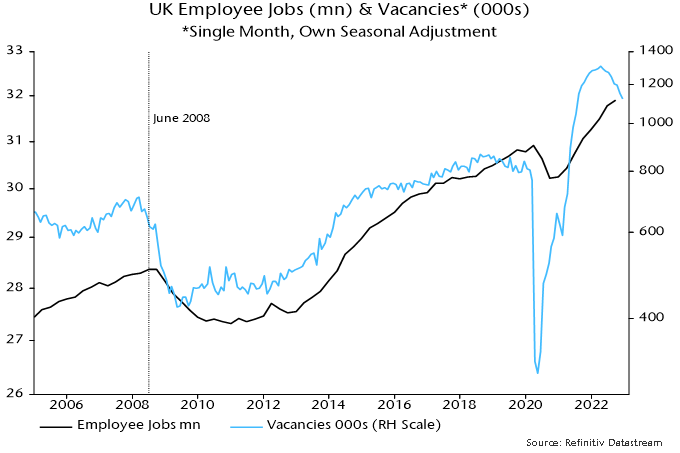
The six-month rate of contraction of real narrow money (i.e. non-financial M1 deflated by consumer prices) was unchanged at 5.9% (not annualised) in December, close to a 6.1% peak reached in October 2008 – see chart 1.
Chart 1
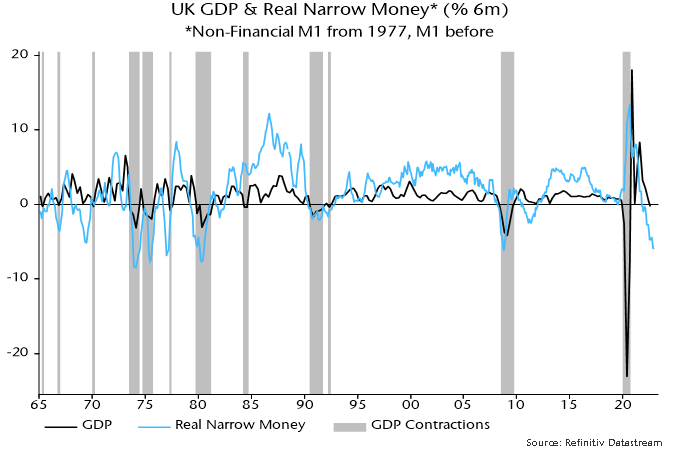
As in 2008, the real money squeeze reflects both high inflation and nominal money weakness. Sectoral nominal money trends are uncannily similar to mid-2008. Corporate M1 and M4 are contracting rapidly, consistent with a sharp fall in profits and suggesting cuts in employment and investment – chart 2.
Chart 2
Household M4 is still growing modestly but there has been a large-scale switch out of sight into time deposits in response to rising rates – a classic signal of a shift in consumer behaviour from spending to saving.
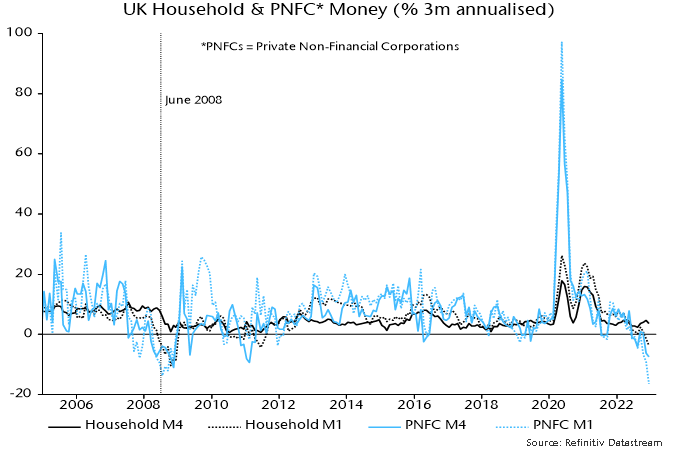
A continued rise in employee numbers in recent months has fed a narrative of labour market “resilience” that is expected to persist. Data and complacency were similar in mid-2008. The quarterly employee jobs series rose into Q3 2008 but the stock of vacancies in June was already down by 9% from its peak, warning of trouble ahead – chart 3. The level of vacancies is higher now but the fall from the peak has been larger, at 14%.
Chart 3