Better Chinese monetary news
Chinese monetary statistics for January suggest that policy easing is starting to become effective.
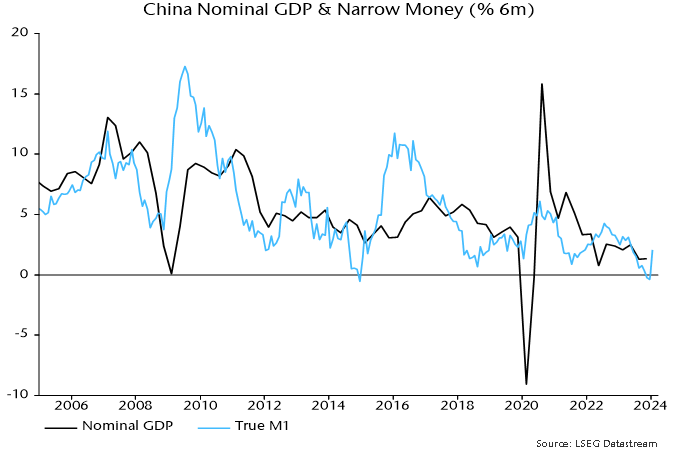
Six-month growth of narrow money, as measured by true M1*, rebounded from a negative December reading to its highest level since May – see chart 1.
Chart 1


Q1 numbers can be volatile because of New Year timing effects, so improvement needs to be confirmed by February / March data.
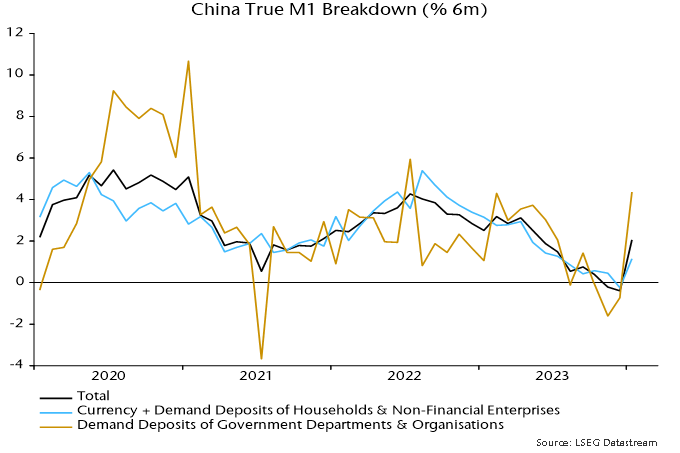
True M1 can be broken down into “private” and “public” sector components. The former aggregates currency in circulation and demand deposits of households and non-financial enterprises. The latter is calculated as a residual and is dominated by demand deposits of government departments and organisations.
Six-month growth rates of both components rose in January but the public sector increase was much larger, consistent with funds being mobilised to boost fiscal spending – chart 2.
Chart 2


Progress in implementing fiscal stimulus is also suggested by a strong rise in central government deposits – these are excluded from money definitions but deployment of funds will have a positive monetary impact.
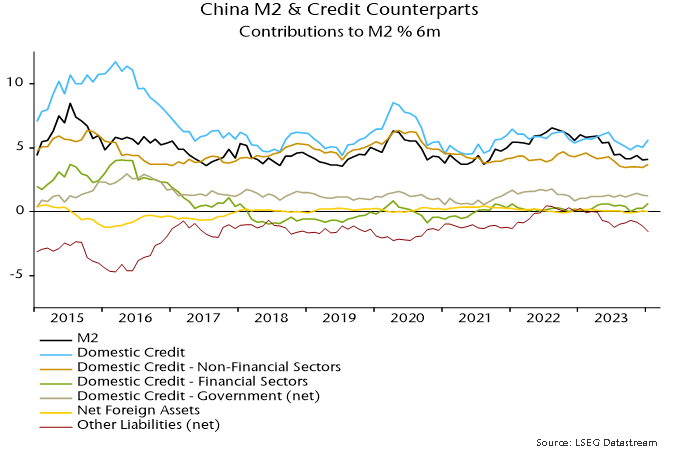
The broader M2 measure continues to outpace narrow money, with six-month growth little changed in January, extending a recent sideways movement. In terms of the “credit counterparts”, domestic credit expansion has firmed since late 2023 but there has been an offsetting increase in non-monetary funding (“other liabilities”) – chart 3.
Chart 3


A reduction in the broad / narrow money growth gap driven by narrow acceleration is usually a positive economic signal, indicating a rise in broad money velocity.
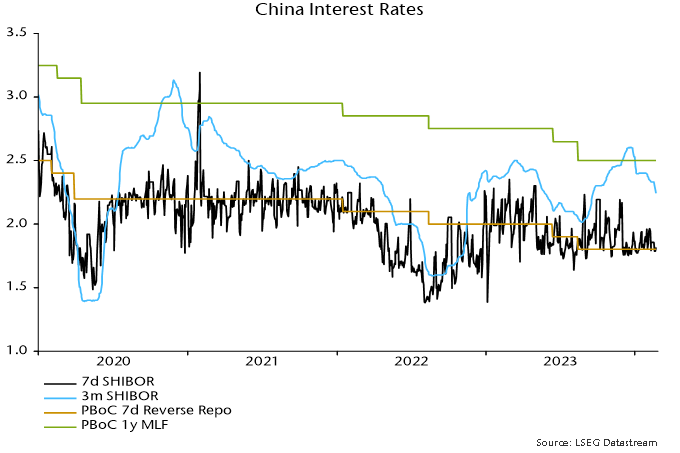
The January narrow money recovery, as noted, partly reflects implementation of fiscal spending plans. A sustained pick-up requires monetary policy to be sufficiently accommodative. Recent developments are promising. PBoC lending to the banking system grew by a record amount in Q4. Banks’ excess reserve ratio rose to 2.1%, the highest since Q4 2020 – before the recent 0.5 pp further reduction in the requirement ratio. The reserves injection has contributed to three-month SHIBOR reversing half of its August-December rise since the start of the year – chart 4. Currency weakness has remained contained despite softer rates; indeed, the JP Morgan effective index has risen slightly year-to-date.
Chart 4


Monetary deterioration into late 2023 argues for economic weakness through H1 2024. Confirmation that monetary trends have turned would suggest improving prospects for H2.
*Official M1 plus household demand deposits. M1 conventionally includes such deposits but they are omitted from the Chinese official measure for historical reasons.