Monetary conditions still tightening
Global six-month real narrow money momentum is estimated to have broken to a new low in August, reinforcing pessimism here about economic prospects and casting strong doubt on now widely-held “soft landing” hopes.
Real money momentum bottomed in July 2022, recovered during H2 but suffered a relapse in early 2023, retesting the 2022 low in April. The relapse has been reflected in a renewed downswing in economic momentum, as proxied by global composite PMI new orders – see chart 1.
Chart 1
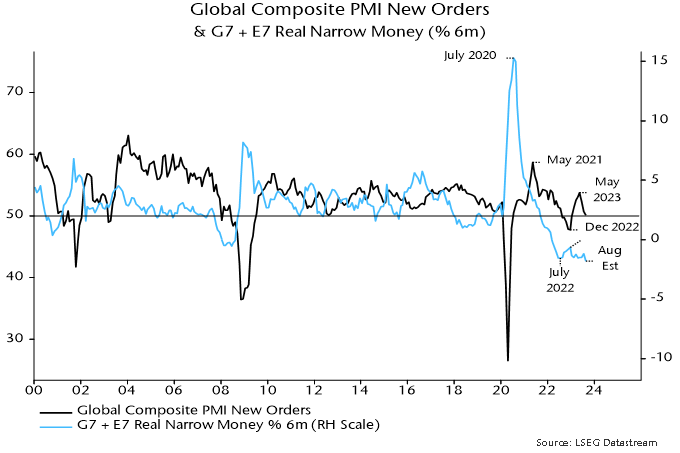
A tentative stabilisation of real money momentum over the summer suggested that PMI new orders would bottom out around year-end. The further move down in August, if confirmed, signals deeper and more extended economic weakness.
The August estimate is based on monetary data covering 70% the global (i.e. G7 plus E7) aggregate and near-complete CPI results.
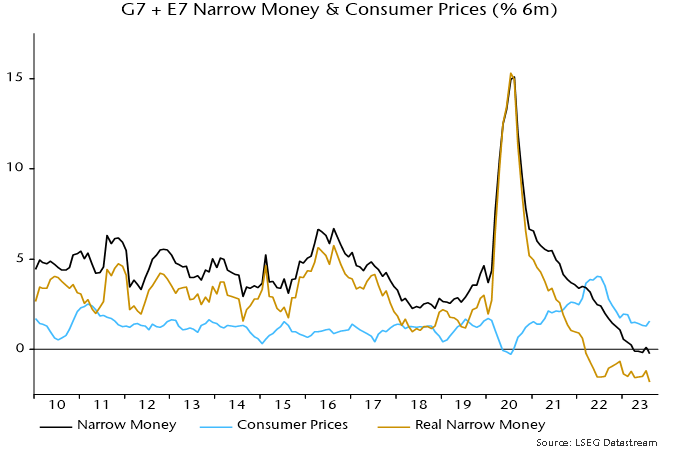
The suggested fall to a new low reflects both additional nominal money weakness and an oil-price-driven recovery in six-month CPI momentum – chart 2.
Chart 2
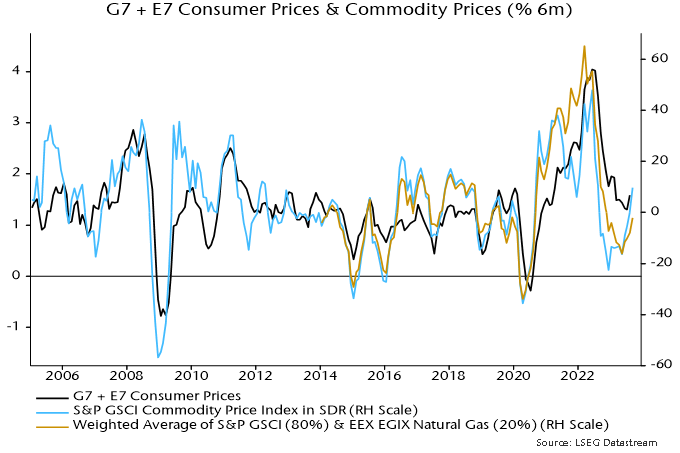
The ongoing oil price rally suggests a further near-term rise in headline CPI momentum – chart 3. A core slowdown, however, is expected to continue and may accelerate as higher oil costs squeeze spending on other items.
Chart 3
The further fall in real narrow money momentum has been driven mainly by China and India – chart 4. An earlier post attributed Chinese monetary weakness to misguided policy tightening in late 2022, which has since been partially reversed. Chinese August money numbers suggest greater damage from the misstep than previously assumed, implying a more urgent need for additional policy easing.
Chart 4

An August estimate of global industrial output is not yet available but a large negative differential between six-month rates of change of real narrow money and output is likely to have persisted – chart 5.
Chart 5
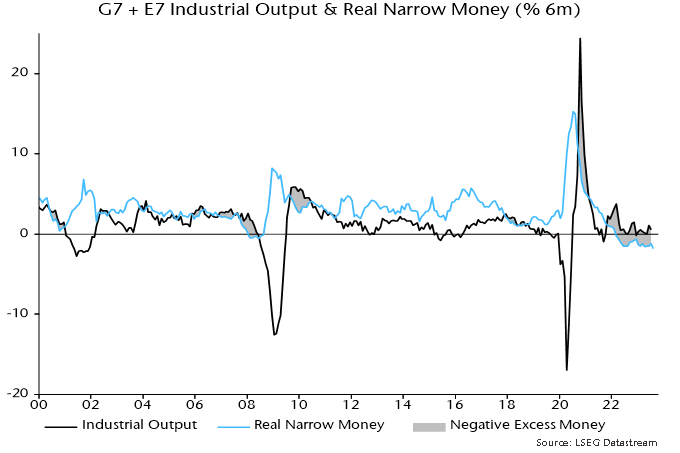
As previously noted, global equities have underperformed cash since this differential turned negative in early 2022 (allowing for reporting lags), despite a rally over the last 12 months.
Why was weakness compressed into the first nine months of 2022, with a subsequent strong rebound?
One explanation is that the Ukraine invasion and associated immediate further upward pressure on energy prices exaggerated the market response to monetary deterioration. Positioning and sentiment reached oversold extremes in late 2022, creating the potential for a relief rally as energy markets adjusted and prices fell back.
Another possibility – admittedly difficult to assess – is that the “excess” money backdrop has been less unfavourable than suggested by the six-month momentum differential shown in chart 5, because of the existence of an overhang from the 2020-21 monetary surge. An excess stock of money, in other words, may have persisted despite the flow turning negative.
The ratio of the stock of real narrow money to industrial output has trended higher over time, with the increase reflected in rising real asset prices and wealth – chart 6.
Chart 6
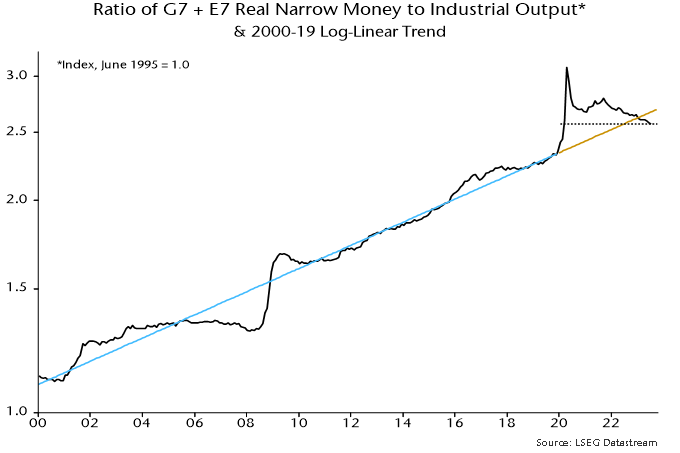
A huge overshoot in 2020-21 has been correcting since late 2021 but the ratio was still above its pre-pandemic trend at end-2022, i.e. the negative flow differential had not fully offset the prior period of excess.
The stock and flow signals, however, are now aligned: the real money / output ratio moved below trend in early 2023 and its July level was the lowest since February 2020 before the policy response to the pandemic and subsequent monetary surge.