Money Moves Markets
Is the high yield rally sustainable?
August 11, 2022 by Simon Ward
The yield spread over Treasuries of the ICE BofA US corporate high yield index rose from 310 bp at end-December to a peak of 599 in early July. It has since retraced more than half of this move. Was the early July peak a major top, with a further decline in prospect? This seems unlikely, for several reasons.
First, the “financing gap” of non-financial corporations – the difference between capital spending and domestic retained earnings – is a long leading indicator of credit spreads and has widened significantly in recent quarters.
Chart 1 shows an expanded measure of the gap including financing required for net equity purchases. This measure moved from a negative position (i.e. a surplus) in Q1 2021 to 4.3% of GDP in Q1 this year, reflecting a strong rise in capital spending – including on inventories – and a pick-up in equity buying.
Chart 1
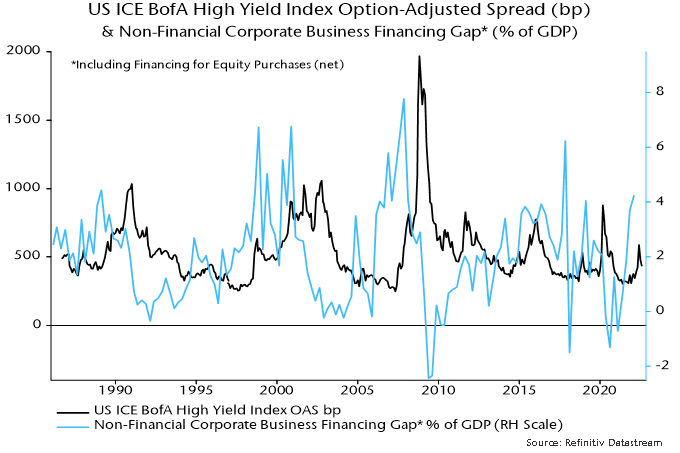
The expanded financing gap rose above 4% of GDP in 1989, 1998, 2000, 2006 and 2019. The high yield spread subsequently increased to at least 850 bp. (The gap also exceeded 4% in Q4 2017 but was temporarily inflated that quarter by revenue shifting by corporations to take advantage of lower tax rates from 2018 – there was an offsetting surplus in Q1 2018.)
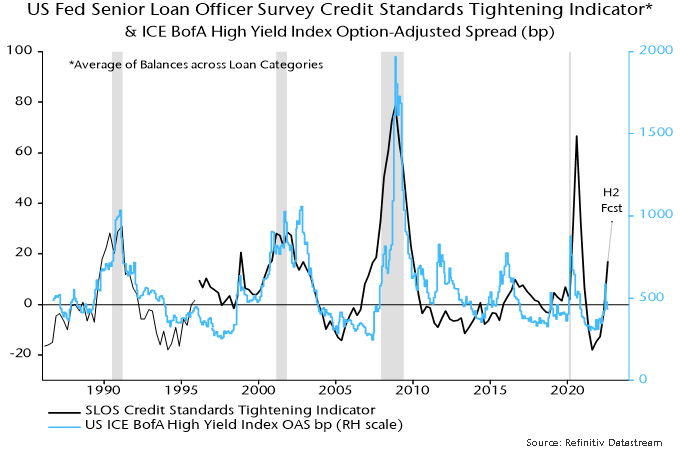
Secondly, the high yield spread correlates contemporaneously with the credit tightening balance in the Fed’s senior loan officer survey – chart 2. This rose sharply between April and July and special questions in the July survey suggest a further increase in H2 – see previous post for more details.
Chart 2
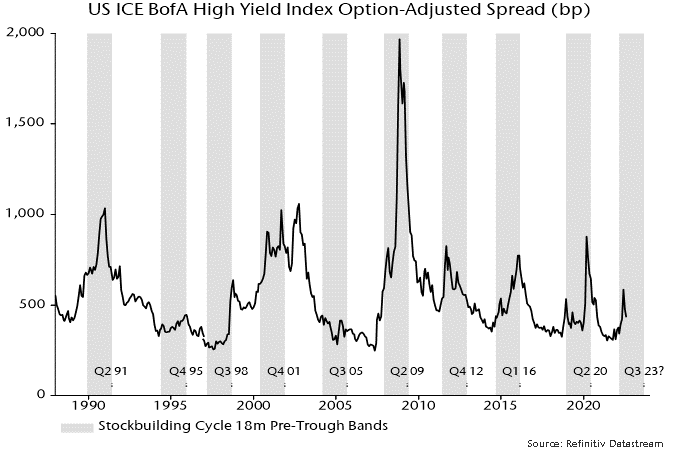
Thirdly, the stockbuilding cycle is judged here to have entered a downswing that may – based on the average length of the cycle – extend into mid to late 2023. Historically, the high yield spread has usually peaked late in the downswing or even after the trough – chart 3. The 2011-12 downswing was an exception but the early surge in the spread on that occasion probably reflected credit market contagion from the Eurozone sovereign debt crisis.
Chart 3
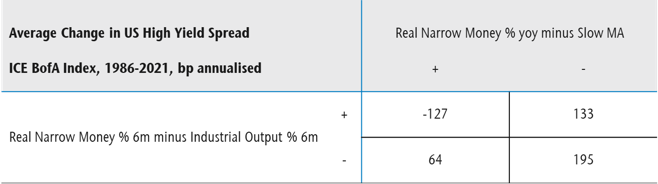
Finally, the two measures of global “excess” money tracked here remain negative, a condition historically associated with a widening spread on average – table 1. The first measure – the gap between six-month real narrow money and industrial output momentum – may turn positive during H2 but the second measure – the deviation of 12-month real momentum from a moving average – will almost certainly remain negative. That combination has also been negative for credit historically.
Table 1